
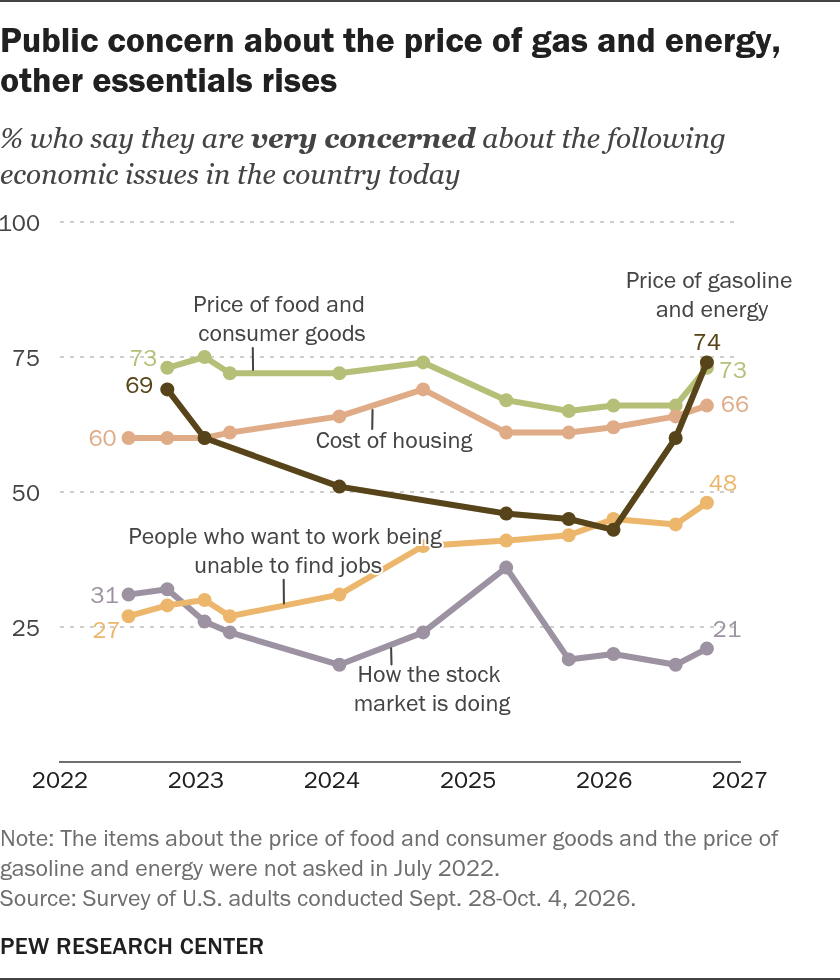
A month out from this year’s congressional elections, the costs of many household essentials are a top economic concern for most Americans – much as they were four years ago on the eve of the last midterm election.
| Date | Price of food and consumer goods | How the stock market is doing | Cost of housing | People who want to work being unable to find jobs | Price of gasoline and energy |
|---|---|---|---|---|---|
| 2022-07-04 | — | 31 | 60 | 27 | — |
| 2022-10-16 | 73 | 32 | 60 | 29 | 69 |
| 2023-01-24 | 75 | 26 | 60 | 30 | 60 |
| 2023-04-02 | 72 | 24 | 61 | 27 | — |
| 2024-01-21 | 72 | 18 | 64 | 31 | 51 |
| 2024-09-02 | 74 | 24 | 69 | 40 | — |
| 2025-04-13 | 67 | 36 | 61 | 41 | 46 |
| 2025-09-28 | 65 | 19 | 61 | 42 | 45 |
| 2026-01-26 | 66 | 20 | 62 | 45 | 43 |
| 2026-07-12 | 66 | 18 | 64 | 44 | 60 |
| 2026-10-04 | 73 | 21 | 66 | 48 | 74 |
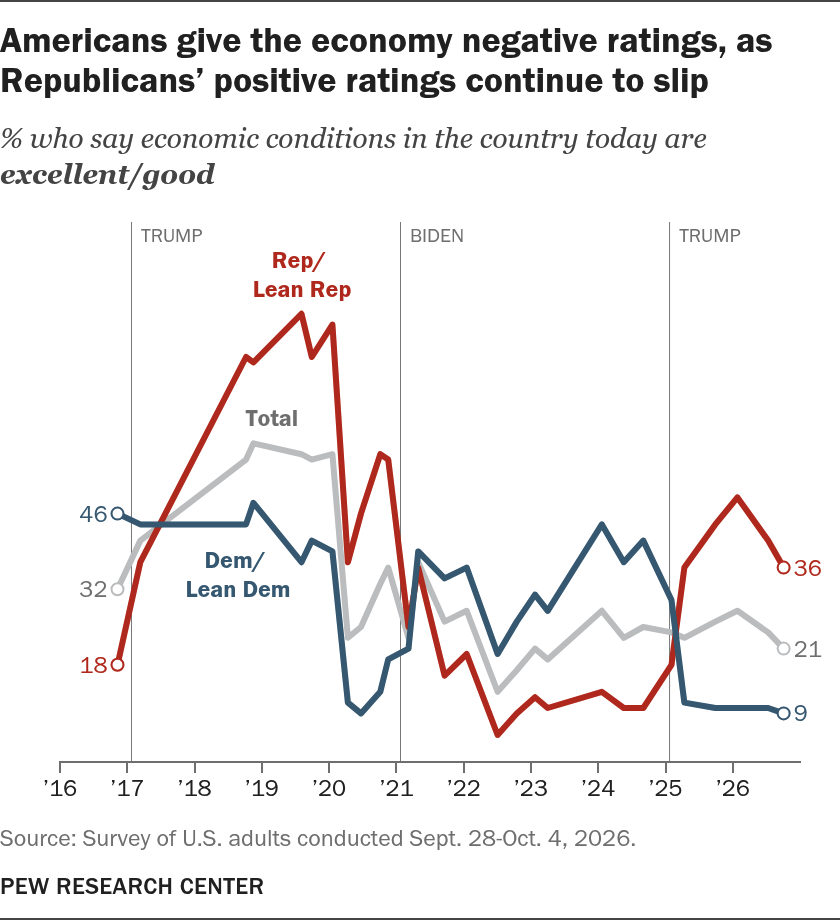
Americans also have a glum view of national economic conditions: Just 21% say they are excellent or good, down from 28% at the start of the year. This is one of the lowest assessments of the economy in either of President Donald Trump’s two terms.
One of the biggest economic concerns of the public is about the price of gas and energy. Today, 74% of Americans say they are very concerned about this, up from 60% in July. In January – before the United States’ military conflict with Iran – 43% said they were very concerned about gas and energy prices.
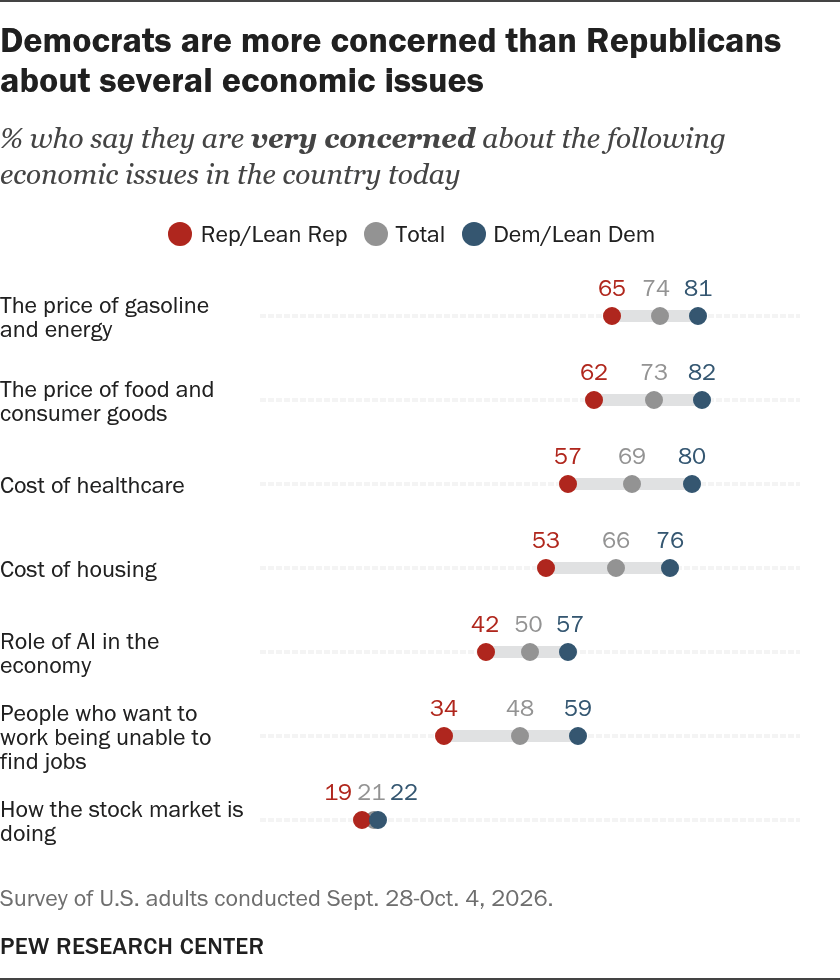
Concern about gas prices is up across the political spectrum over this period, though it is higher among Democrats and Democratic-leaning independents (81% say they are very concerned) than among Republicans and Republican leaners (65%).
The new Pew Research Center survey of 5,062 U.S. adults, conducted from Sept. 28 to Oct. 4, 2026, also finds wide majorities saying they are very concerned about the cost of:
- Food and consumer goods (73%)
- Healthcare (69%)
- Housing (66%)
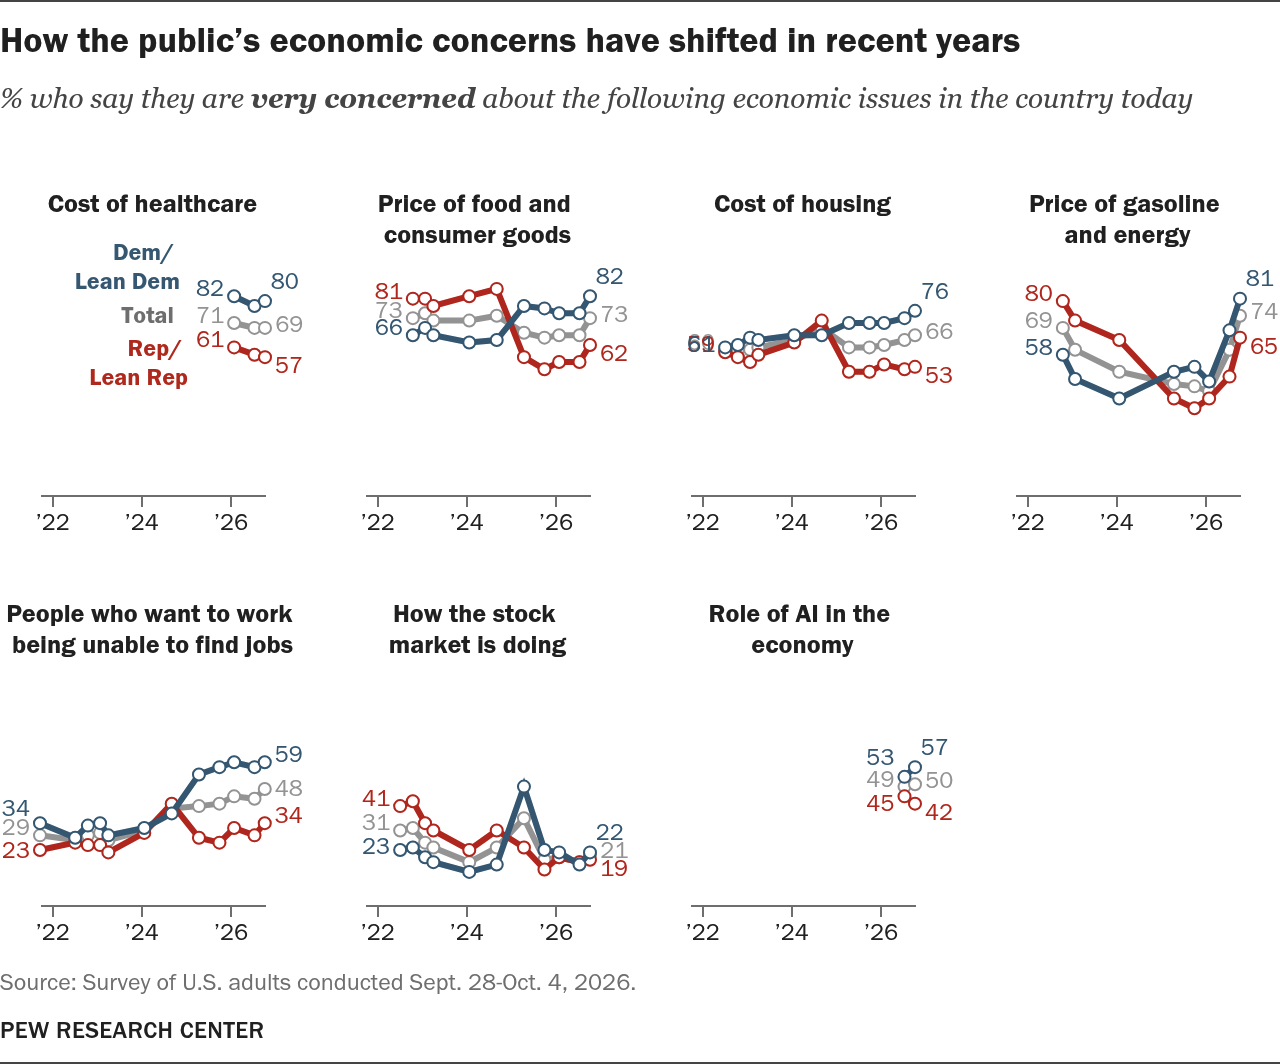
While concerns about the job market are not as widespread, they have also risen in recent months: 48% now say they are very concerned about people who want to work being unable to find jobs, up from 44% in July and substantially higher than the 29% who said this in October 2022.
Half of the public say they are very concerned about the role of artificial intelligence (AI) in the economy.
In contrast, few Americans are very concerned about how the stock market is doing (21%).
Related: “With Americans in a Sour Mood, Democratic Voters Are More Engaged in Midterms.”
Overall views of the economy
Americans’ economic ratings have ticked more negative over the last few months: Today, 21% describe economic conditions as excellent or good, while 37% say they are only fair and 42% say they are poor. In July, 24% said economic conditions were excellent or good.
| Date | Total | Rep/Lean Rep | Dem/Lean Dem |
|---|---|---|---|
| 2016-11-08 | 32 | 18 | 46 |
| 2017-03-12 | 41 | 37 | 44 |
| 2018-10-07 | 56 | 75 | 44 |
| 2018-11-16 | 59 | 74 | 48 |
| 2019-08-04 | 57 | 83 | 37 |
| 2019-09-29 | 56 | 75 | 41 |
| 2020-01-19 | 57 | 81 | 39 |
| 2020-04-12 | 23 | 37 | 11 |
| 2020-06-22 | 25 | 46 | 9 |
| 2020-10-05 | 33 | 57 | 13 |
| 2020-11-17 | 36 | 56 | 19 |
| 2021-03-07 | 23 | 25 | 21 |
| 2021-04-29 | 37 | 36 | 39 |
| 2021-09-19 | 26 | 16 | 34 |
| 2022-01-17 | 28 | 20 | 36 |
| 2022-07-04 | 13 | 5 | 20 |
| 2022-10-16 | 17 | 9 | 26 |
| 2023-01-23 | 21 | 12 | 31 |
| 2023-04-02 | 19 | 10 | 28 |
| 2024-01-21 | 28 | 13 | 44 |
| 2024-05-19 | 23 | 10 | 37 |
| 2024-09-02 | 25 | 10 | 41 |
| 2025-02-02 | 24 | 18 | 30 |
| 2025-04-13 | 23 | 36 | 11 |
| 2025-09-28 | 26 | 44 | 10 |
| 2026-01-26 | 28 | 49 | 10 |
| 2026-07-12 | 24 | 41 | 10 |
| 2026-10-04 | 21 | 36 | 9 |
The near-term decline in ratings is driven by a shift in Republicans’ views.
Today, 36% of Republicans see the economy as in excellent or good shape, down from 41% in July. About a quarter of Republicans (23%) now say conditions are poor, up from 19% in July.
The share of Democrats who say the economy is excellent or good (9%) is largely unchanged since July, but the share who say conditions are poor has risen (56% now vs. 48% then).
Economic outlook
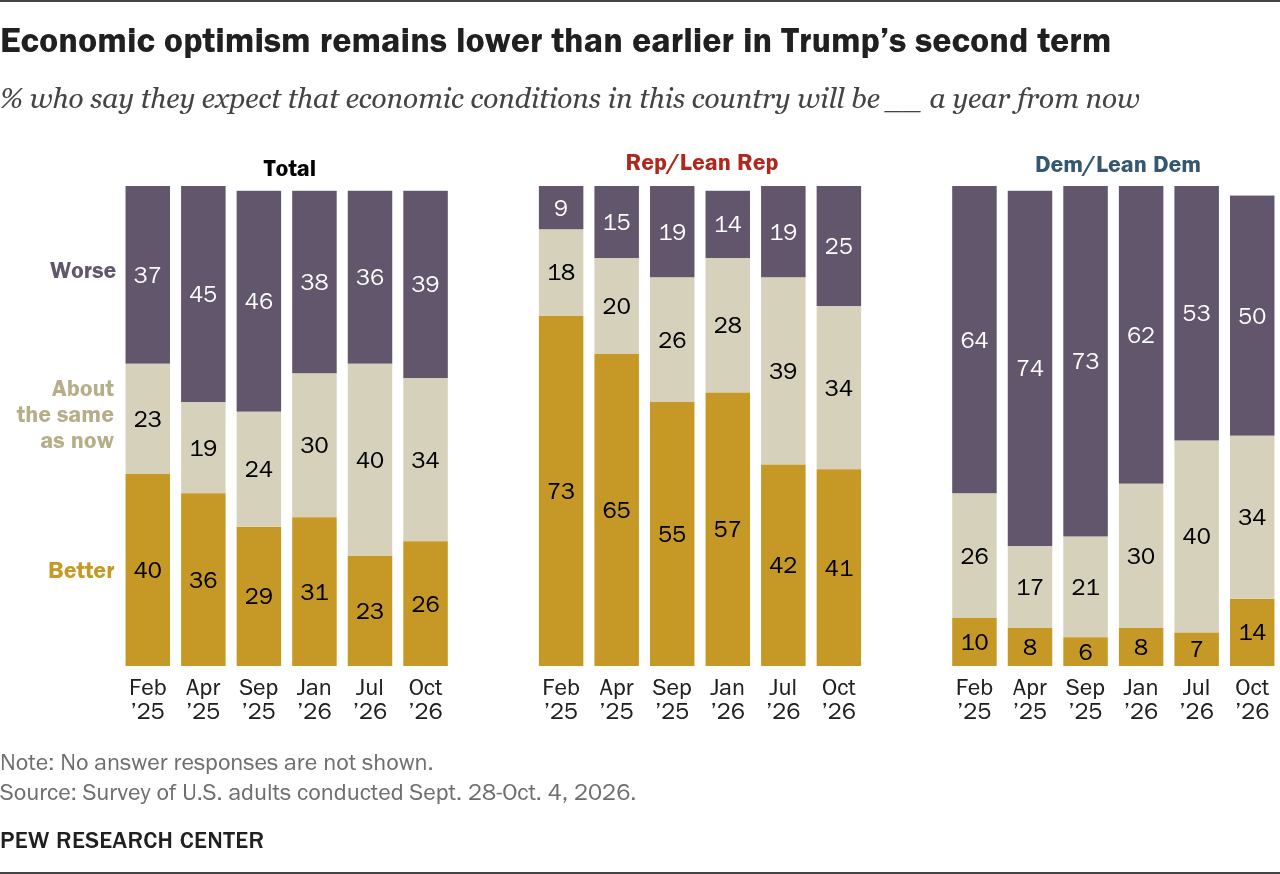
About a quarter of Americans (26%) say that they expect economic conditions will be better in a year, while roughly a third (34%) say conditions will be about the same and about four-in-ten (39%) expect them to worsen.
Republicans (41%) are more optimistic than Democrats (14%) about future conditions. Half of Democrats and a quarter of Republicans are pessimistic, saying things will get worse.
For trends on economic optimism, refer to Additional charts.
What has the impact of Trump’s economic policies been?
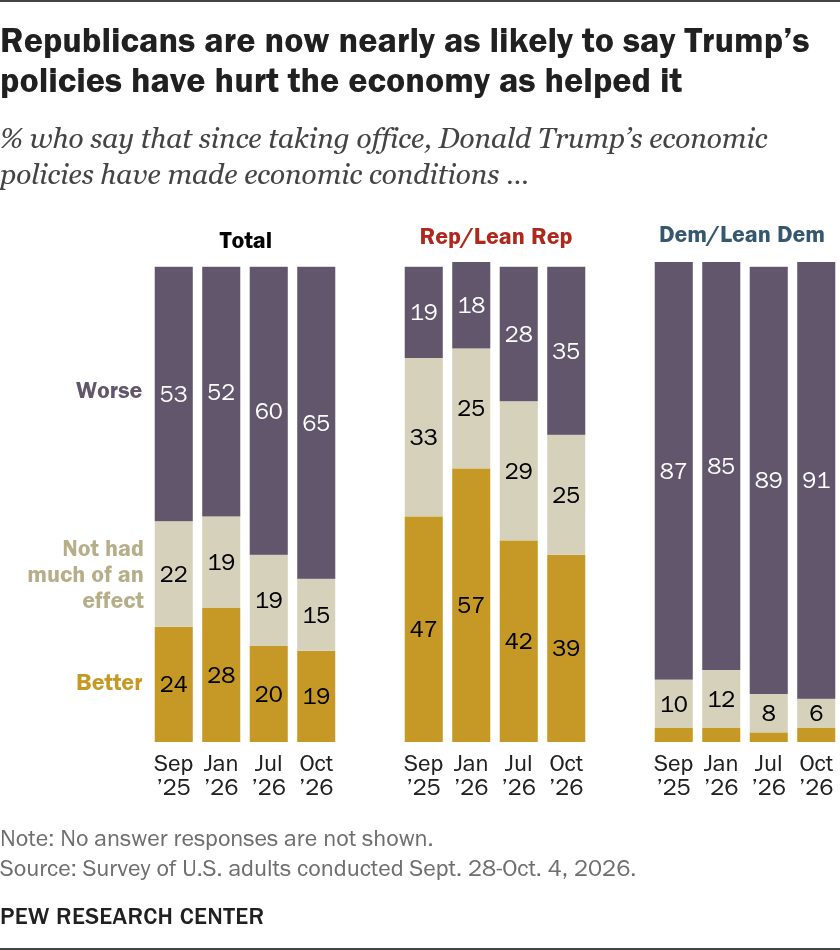
Most Americans see Donald Trump’s economic policies as hurting the economy:
- 65% say they have made things worse.
- 15% say they have not had much of an effect.
- 19% say his policies have made conditions better.
| Date | Group | Better | Worse | Not had much of an effect |
|---|---|---|---|---|
| Sep ’25 | Total | 24 | 53 | 22 |
| Jan ’26 | Total | 28 | 52 | 19 |
| Jul ’26 | Total | 20 | 60 | 19 |
| Oct ’26 | Total | 19 | 65 | 15 |
| Sep ’25 | Rep/Lean Rep | 47 | 19 | 33 |
| Jan ’26 | Rep/Lean Rep | 57 | 18 | 25 |
| Jul ’26 | Rep/Lean Rep | 42 | 28 | 29 |
| Oct ’26 | Rep/Lean Rep | 39 | 35 | 25 |
| Sep ’25 | Dem/Lean Dem | 3 | 87 | 10 |
| Jan ’26 | Dem/Lean Dem | 3 | 85 | 12 |
| Jul ’26 | Dem/Lean Dem | 2 | 89 | 8 |
| Oct ’26 | Dem/Lean Dem | 3 | 91 | 6 |
Republicans are divided over the impact of Trump’s policies – a shift over the last year:
- 39% say Trump’s policies have made economic conditions better – down from 47% last fall and 57% in January.
- 35% say his policies have made things worse – up from 18% at the start of the year.
- 25% say his policies have not had much of an effect – the same share as in January.
Democrats continue to overwhelmingly see Trump’s policies as making economic conditions worse (91% say this today).
Views of tariff policies
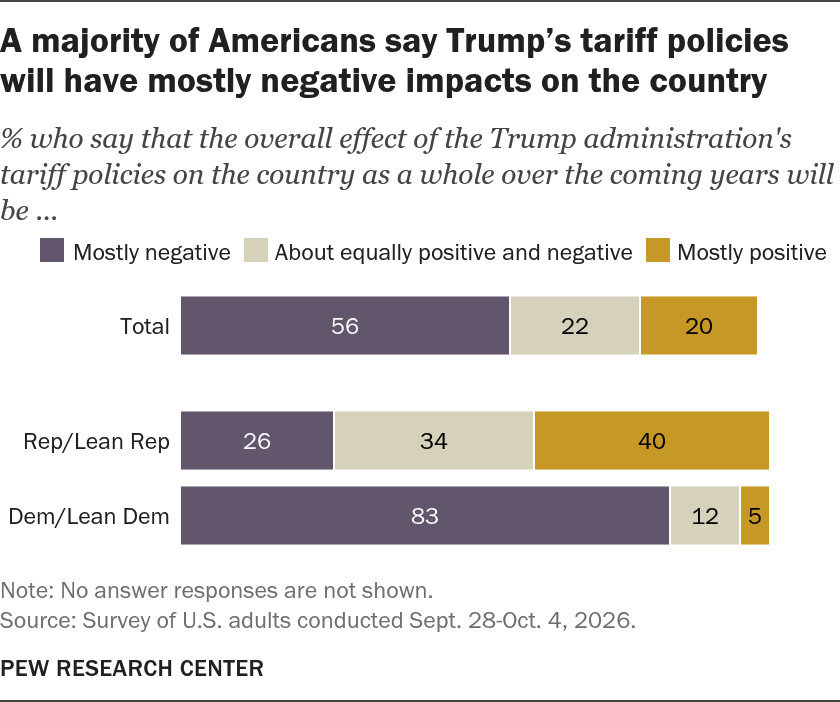
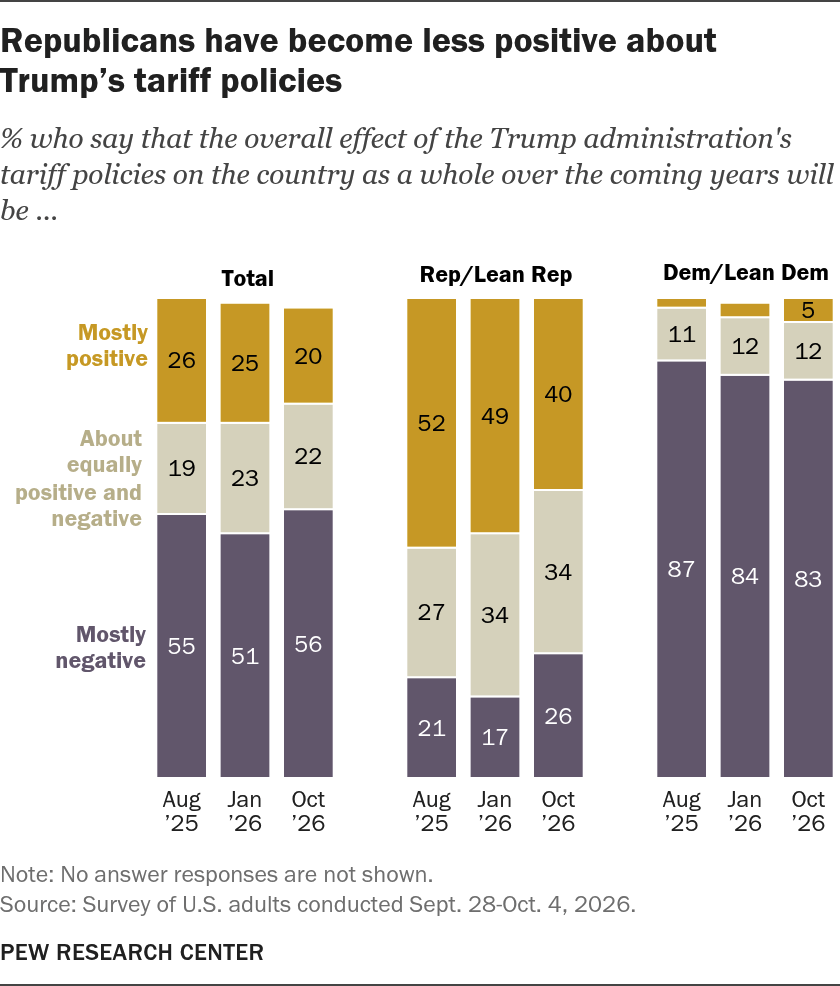
By more than two-to-one, Americans see the administration’s tariff policies as having a more negative (56%) than positive effect (20%) on the country in the coming years. About two-in-ten (22%) say the impact will be mixed.
| Mostly positive | About equally positive and negative | Mostly negative | Grouping | |
|---|---|---|---|---|
| Total | 20 | 22 | 56 | 1 |
| Rep/Lean Rep | 40 | 34 | 26 | 2 |
| Dem/Lean Dem | 5 | 12 | 83 | 2 |
Among Republicans
Four-in-ten Republicans say the tariffs will have a mostly positive impact (40%) on the country – down from 52% in August 2025 and 49% in January of this year.
About a quarter of Republicans (26%) now say the tariffs will be bad for the country – up from 21% last summer and 17% at the start of the year.
Roughly a third of Republicans (34%) continue to say the tariffs will have a mix of positive and negative consequences.
Among Democrats
Democrats overwhelmingly say Trump’s tariffs will have a negative impact on the country (83% say this). Their views are little changed since last year.
For trends on views of tariff policy, refer to Additional charts.
Partisan differences on economic concerns
Democrats express more concern than Republicans on most of the economic issues asked about on the survey, as they did in July and at the start of Trump’s second term.
| Topic | Total | Rep/Lean Rep | Dem/Lean Dem |
|---|---|---|---|
| The price of gasoline and energy | 74 | 65 | 81 |
| The price of food and consumer goods | 73 | 62 | 82 |
| Cost of healthcare | 69 | 57 | 80 |
| Cost of housing | 66 | 53 | 76 |
| Role of AI in the economy | 50 | 42 | 57 |
| People who want to work being unable to find jobs | 48 | 34 | 59 |
| How the stock market is doing | 21 | 19 | 22 |
Even as there are wide partisan gaps in concerns about prices of gasoline, energy, food, consumer goods and healthcare, majorities in both parties say they are very concerned about these issues.
Democrats are also more concerned than Republicans about the role of AI in the economy and people who want to work being unable to find jobs.
Relatively few in either party say they are concerned about how the stock market is doing.
For full trends on economic concerns by party, refer to Additional charts.
Additional charts
| Date | Group | Better | Worse | About the same as now |
|---|---|---|---|---|
| Feb ’25 | Total | 40 | 37 | 23 |
| Apr ’25 | Total | 36 | 45 | 19 |
| Sep ’25 | Total | 29 | 46 | 24 |
| Jan ’26 | Total | 31 | 38 | 30 |
| Jul ’26 | Total | 23 | 36 | 40 |
| Oct ’26 | Total | 26 | 39 | 34 |
| Feb ’25 | Rep/Lean Rep | 73 | 9 | 18 |
| Apr ’25 | Rep/Lean Rep | 65 | 15 | 20 |
| Sep ’25 | Rep/Lean Rep | 55 | 19 | 26 |
| Jan ’26 | Rep/Lean Rep | 57 | 14 | 28 |
| Jul ’26 | Rep/Lean Rep | 42 | 19 | 39 |
| Oct ’26 | Rep/Lean Rep | 41 | 25 | 34 |
| Feb ’25 | Dem/Lean Dem | 10 | 64 | 26 |
| Apr ’25 | Dem/Lean Dem | 8 | 74 | 17 |
| Sep ’25 | Dem/Lean Dem | 6 | 73 | 21 |
| Jan ’26 | Dem/Lean Dem | 8 | 62 | 30 |
| Jul ’26 | Dem/Lean Dem | 7 | 53 | 40 |
| Oct ’26 | Dem/Lean Dem | 14 | 50 | 34 |
| Date | Topic | Total | Rep/Lean Rep | Dem/Lean Dem | |
|---|---|---|---|---|---|
| 2021-09-19 | People who want to work being unable to find jobs | 29 | 23 | 34 | 1 |
| 2022-07-04 | People who want to work being unable to find jobs | 27 | 26 | 28 | 1 |
| 2022-10-16 | People who want to work being unable to find jobs | 29 | 25 | 33 | 1 |
| 2023-01-24 | People who want to work being unable to find jobs | 30 | 25 | 34 | 1 |
| 2023-04-02 | People who want to work being unable to find jobs | 27 | 22 | 29 | 1 |
| 2024-01-21 | People who want to work being unable to find jobs | 31 | 30 | 32 | 1 |
| 2024-09-02 | People who want to work being unable to find jobs | 40 | 42 | 38 | 1 |
| 2025-04-13 | People who want to work being unable to find jobs | 41 | 28 | 54 | 1 |
| 2025-09-28 | People who want to work being unable to find jobs | 42 | 26 | 57 | 1 |
| 2026-01-26 | People who want to work being unable to find jobs | 45 | 32 | 59 | 1 |
| 2026-07-12 | People who want to work being unable to find jobs | 44 | 29 | 57 | 1 |
| 2026-10-04 | People who want to work being unable to find jobs | 48 | 34 | 59 | 1 |
| 2022-07-04 | Cost of housing | 60 | 59 | 61 | 2 |
| 2022-10-16 | Cost of housing | 60 | 57 | 62 | 2 |
| 2023-01-24 | Cost of housing | 60 | 55 | 65 | 2 |
| 2023-04-02 | Cost of housing | 61 | 58 | 64 | 2 |
| 2024-01-21 | Cost of housing | 64 | 63 | 66 | 2 |
| 2024-09-02 | Cost of housing | 69 | 72 | 66 | 2 |
| 2025-04-13 | Cost of housing | 61 | 51 | 71 | 2 |
| 2025-09-28 | Cost of housing | 61 | 51 | 71 | 2 |
| 2026-01-26 | Cost of housing | 62 | 54 | 71 | 2 |
| 2026-07-12 | Cost of housing | 64 | 52 | 73 | 2 |
| 2026-10-06 | Cost of housing | 66 | 53 | 76 | 2 |
| 2022-10-16 | Price of gasoline and energy | 69 | 80 | 58 | 3 |
| 2023-01-24 | Price of gasoline and energy | 60 | 72 | 48 | 3 |
| 2024-01-21 | Price of gasoline and energy | 51 | 64 | 40 | 3 |
| 2025-04-13 | Price of gasoline and energy | 46 | 40 | 51 | 3 |
| 2025-09-28 | Price of gasoline and energy | 45 | 36 | 53 | 3 |
| 2026-01-26 | Price of gasoline and energy | 43 | 40 | 47 | 3 |
| 2026-07-12 | Price of gasoline and energy | 60 | 49 | 68 | 3 |
| 2026-10-06 | Price of gasoline and energy | 74 | 65 | 81 | 3 |
| 2022-10-16 | Price of food and consumer goods | 73 | 81 | 66 | 4 |
| 2023-01-24 | Price of food and consumer goods | 75 | 81 | 69 | 4 |
| 2023-04-02 | Price of food and consumer goods | 72 | 78 | 66 | 4 |
| 2024-01-21 | Price of food and consumer goods | 72 | 82 | 63 | 4 |
| 2024-09-02 | Price of food and consumer goods | 74 | 85 | 64 | 4 |
| 2025-04-13 | Price of food and consumer goods | 67 | 57 | 78 | 4 |
| 2025-09-28 | Price of food and consumer goods | 65 | 52 | 77 | 4 |
| 2026-01-26 | Price of food and consumer goods | 66 | 55 | 75 | 4 |
| 2026-07-12 | Price of food and consumer goods | 66 | 55 | 75 | 4 |
| 2026-10-06 | Price of food and consumer goods | 73 | 62 | 82 | 4 |
| 2022-07-04 | How the stock market is doing | 31 | 41 | 23 | 5 |
| 2022-10-16 | How the stock market is doing | 32 | 43 | 24 | 5 |
| 2023-01-24 | How the stock market is doing | 26 | 34 | 20 | 5 |
| 2023-04-02 | How the stock market is doing | 24 | 31 | 18 | 5 |
| 2024-01-21 | How the stock market is doing | 18 | 23 | 14 | 5 |
| 2024-09-02 | How the stock market is doing | 24 | 31 | 17 | 5 |
| 2025-04-13 | How the stock market is doing | 36 | 24 | 49 | 5 |
| 2025-09-28 | How the stock market is doing | 19 | 15 | 23 | 5 |
| 2026-01-26 | How the stock market is doing | 20 | 20 | 22 | 5 |
| 2026-07-12 | How the stock market is doing | 18 | 18 | 17 | 5 |
| 2026-10-06 | How the stock market is doing | 21 | 19 | 22 | 5 |
| 2026-01-26 | Cost of healthcare | 71 | 61 | 82 | 6 |
| 2026-07-12 | Cost of healthcare | 69 | 58 | 78 | 6 |
| 2026-10-06 | Cost of healthcare | 69 | 57 | 80 | 6 |
| 2026-07-12 | Role of AI in the economy | 49 | 45 | 53 | 7 |
| 2026-10-06 | Role of AI in the economy | 50 | 42 | 57 | 7 |
| Date | Group | Mostly positive | About equally positive and negative | Mostly negative |
|---|---|---|---|---|
| Aug ’25 | Total | 26 | 19 | 55 |
| Jan ’26 | Total | 25 | 23 | 51 |
| Oct ’26 | Total | 20 | 22 | 56 |
| Aug ’25 | Rep/Lean Rep | 52 | 27 | 21 |
| Jan ’26 | Rep/Lean Rep | 49 | 34 | 17 |
| Oct ’26 | Rep/Lean Rep | 40 | 34 | 26 |
| Aug ’25 | Dem/Lean Dem | 2 | 11 | 87 |
| Jan ’26 | Dem/Lean Dem | 3 | 12 | 84 |
| Oct ’26 | Dem/Lean Dem | 5 | 12 | 83 |


