A number of data quality checks have been developed for online surveys. Examples include flagging respondents who fail an attention check (or trap) question, complete the survey too quickly (speeders), give rounded numeric answers, or give the same or nearly the same answer to each question in a battery of questions (straight-lining). Perhaps the two most common of these are the flags for failing an attention check and for speeding.18
A key question is whether these common checks are sufficient for helping pollsters identify and remove bogus respondents before they bias public poll results. This analysis defines a bogus respondent as someone who did any of four things: reported living outside the country, gave multiple non sequitur answers, took the survey multiple times, or always said they approve/favor regardless of what was asked.19 The rate of bogus respondents was 7% in the crowdsourced poll, 5% on average in the three opt-in panel polls, and 1% on average in the two address-recruited panel polls.
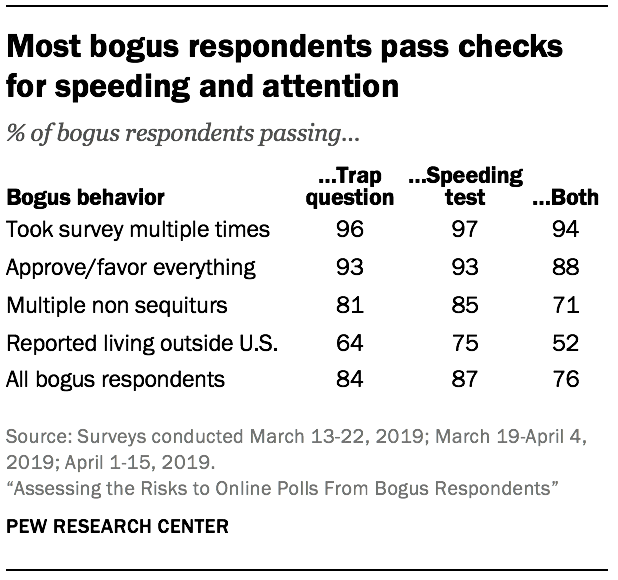
The attention check question in this study read, “Paying attention and reading the instructions carefully is critical. If you are paying attention, please choose Silver below.” Overall, 1.4% of the 62,639 respondents in the study failed the attention check by selecting an answer other than “Silver.” Among the bogus cases, most of them passed the attention check (84%). In other words, a standard attention check does not work for detecting the large majority of cases found to be giving the type of low quality, biasing data bogus respondents engage in. This result suggests that respondents giving bogus data do not answer at random and without reading the question – the behavior attention checks are designed to catch. Instead, this result corroborates the finding from the open-ended data that some bogus respondents, especially those from the crowdsourcing platform, are often trying very hard to give answers they think will be acceptable.
Results for speeding were similar.20 Overall, 1.5% of the 62,639 study respondents were flagged for speeding. Speeding was defined as completing the survey in under three minutes when the median response time was seven minutes. Among the bogus cases, about nine-in-ten (87%) were not speeders.21
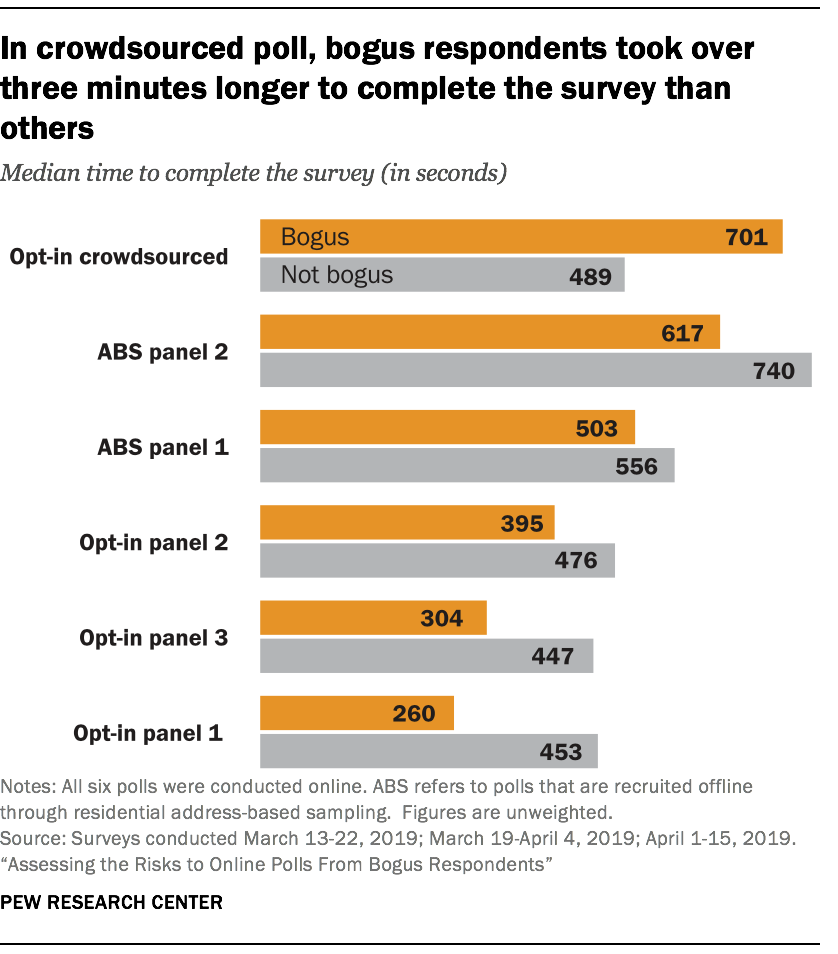
This suggests that a check for too-fast interviews is largely ineffective for detecting cases that are either giving bogus answers or should not be in the survey at all. In the crowdsourced sample, the bogus respondents had a longer median completion time than other respondents (701 versus 489 seconds, respectively).
These results are consistent with the findings from other research teams. Both Ahler and colleagues (2019) and TurkPrime (2018) found that fraudulent crowdsourced respondents were unlikely to speed through the questionnaire. Ahler and colleagues found that “potential trolls and potentially fraudulent IP addresses take significantly longer on the survey on average.” The TurkPrime study found that crowdsourced workers operating through server farms to hide their true location took nearly twice as long to complete the questionnaire as those not using a server farm. They note that their result is consistent with the idea that respondents using server farms “a) have a hard time reading and understanding English and so they spend longer on questions” and “b) are taking multiple HITs at once.”
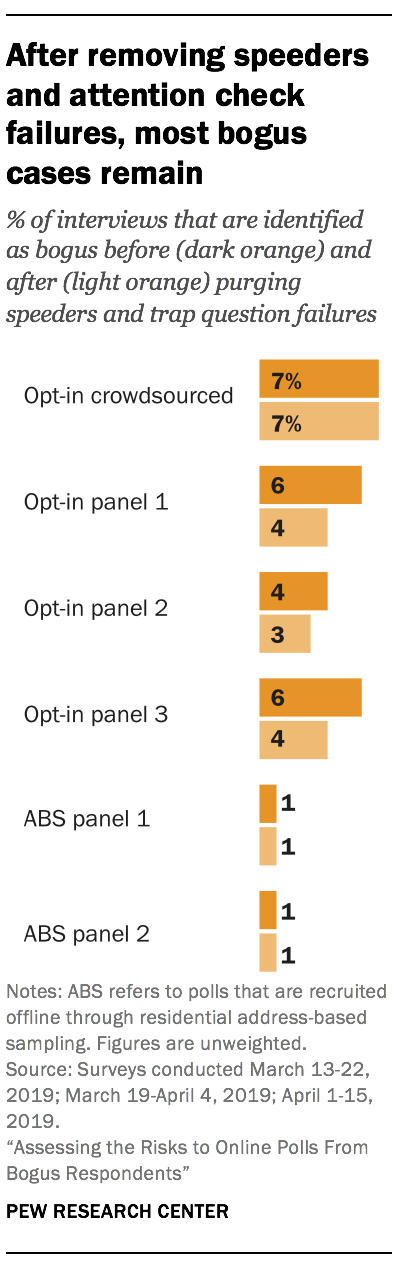
Using the union of the two flags is also only partially effective as a means of identifying bogus respondents. About three-quarters (76%) of bogus cases pass both the attention check and the fast response check. Purging based on speeding and a trap question appears to be somewhat more effective for opt-in and address-recruited panels than the crowdsourced sample. On average, those flags removed 29% of the cases identified as bogus in the opt-in and address-recruited panels but just 7% of the bogus cases in the crowdsourced sample. In sum, these two common data quality checks seem to help but appear to be far from sufficient in terms of removing most bogus interviews.
Respondents taking the survey multiple times was rare and limited to opt-in sources
Another possible quality check is to look for instances where two or more respondents have highly similar answers across the board. Similar to looking at duplicate IP addresses, having similar sets of answers could be an indicator of the same person taking the survey more than once.
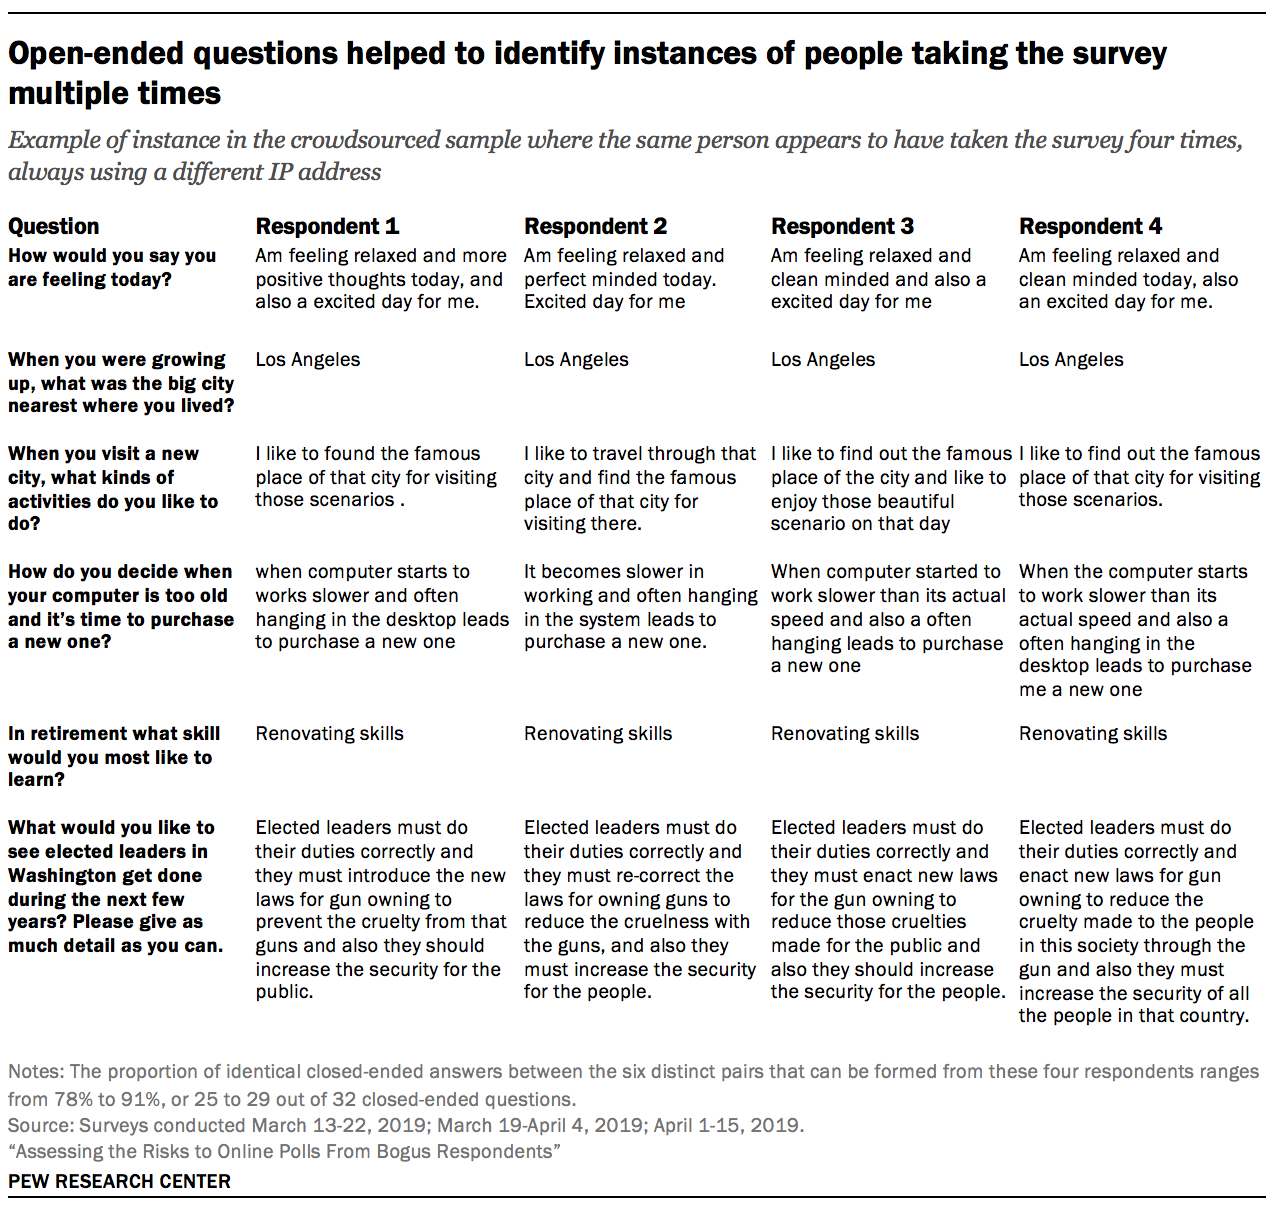
Whether a pair of interviews having the same answers on a large proportion of closed-ended questions indicates duplication is exceedingly tricky to figure out, because various survey features such as the number of questions, the number of response options, the number of respondents, and the homogeneity within the surveyed population affect how natural it is for any two respondents to have very similar answers. However, because the questionnaire in this study also included six open-ended questions, it becomes possible to identify potential duplicate respondents with much higher confidence.
For each open-ended question, researchers compared each respondent’s answer to all the other respondents’ answers using a metric for measuring the similarity between two strings of text.22 This was done separately for each of the six samples. If, for a particular pair of respondents, three or more of their answers to the six open-ended questions exceeded a certain threshold, that pair was flagged for manual review. A researcher then reviewed each pair to assess whether they were a probable duplicate based on word choice and phrasing across multiple open-ended questions. When similar answers consisted entirely of short, common words (e.g., “good” or “not sure”), researchers did not consider that sufficiently strong evidence of a duplicate, as there is not enough lexical content to make a confident determination.
At the end of this process, researchers found that duplicates represented 0.3% of all interviews. The incidence of duplicates was highest in the crowdsourced sample (1.1%), while in the opt-in samples, the incidence ranged from 0.1 to 0.3%. No duplicate interviews were identified in the address-recruited samples.
Researchers examined whether the having an IP address flagged as a duplicate (as described in Chapter 3) was related to the interview being flagged as a duplicate based on this analysis of open-end answers. While there was a relationship, relying on IP addresses alone to detect people answering the survey multiple times is insufficient. Out of the 172 respondents flagged as duplicates based on their open-ended answers, there were 150 unique IP addresses.