
This report included six online platforms used for public polling. Three are opt-in survey panels or “marketplaces.” One is an opt-in crowdsourcing labor website. Two are survey panels that interview online but recruit offline, one of which is Pew Research Center’s American Trends Panel. For both panels recruited offline, most panelists were recruited using address-based sampling (ABS). Before using ABS, both panels recruited offline using random samples of telephone numbers (random digit dialing).
The Center’s American Trends Panel sample was interviewed using normal procedures. The crowdsourced sample was fielded in-house at the Center using a prominent crowdsourcing labor market website. The other four samples were conducted for the Center by a survey data collection firm that served as a coordinating vendor. The Center contracted with the vendor to conduct a “national polling study.” The research aims of the study were not discussed with the coordinating vendor. The questionnaire was the only study document provided to the coordinating vendor and the panels to which they subcontracted.
The vendor was instructed to use formatting, style, and respondent sourcing that is normal for political polls conducted on each of the panels. In theory, Center researchers could have required a set of elaborate quotas for each opt-in source. That was purposefully avoided because it would have damaged the generalizability of the results. Had we required our own custom set of quotas, the study results would only be generalizable to opt-in surveys sampled the way Pew Research Center would do it. But that was not the study goal. Instead, the inferential goal was to field a national public opinion poll from each source using the specifications used by the panel provider for such polls. While some researchers using opt-in sources do use elaborate quotas, many do not. This study is designed to speak to the quality of data public pollsters received when they rely on the opt-in provider to ensure that the sample is sound.
The coordinating vendor was instructed to conduct at least 10,000 interviews with U.S. adults age 18 and older in all 50 states and the District of Columbia from each source. English and Spanish administration was available and used for four of the six sources. For the crowdsourced sample and opt-in survey panel 2, it was only feasible to conduct interviews in English.
The crowdsourced portion of the study was fielded in 11 waves beginning March 19 and ending April 4, 2019. The average wave size was approximately 1,250 respondents. The survey was available to any U.S. adult on the crowdsourced platform. No other filters available through the crowdsourced platform were used. Crowdsourced respondents were paid $2.50 to complete the study.
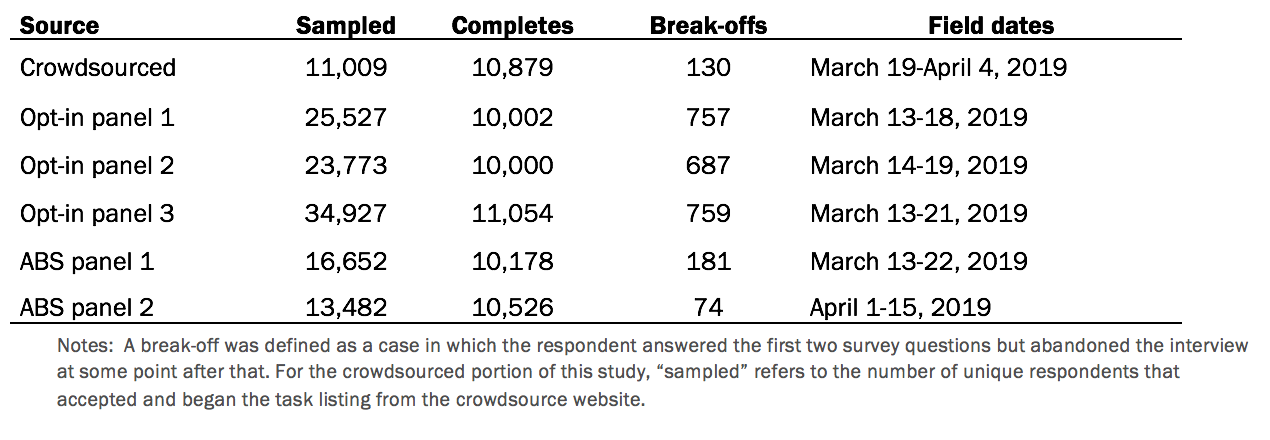
Address-recruited panel 1 had a study-specific response rate of 61%. The cumulative response rate to the survey (accounting for nonresponse to recruitment, to the current survey and for panel attrition) was 5%.
Address-recruited panel 2 had a study-specific response rate of 78%. The cumulative response rate to the survey (accounting for nonresponse to recruitment, to the current survey and for panel attrition) was 4%.
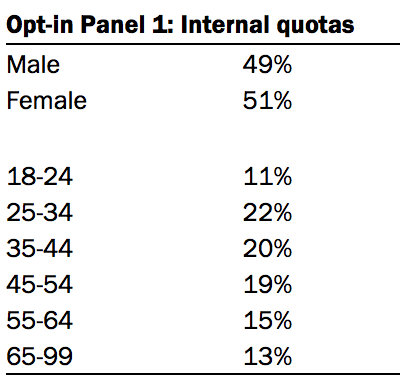
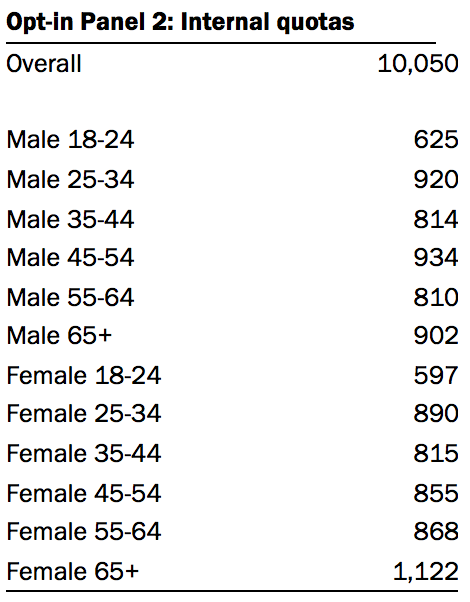
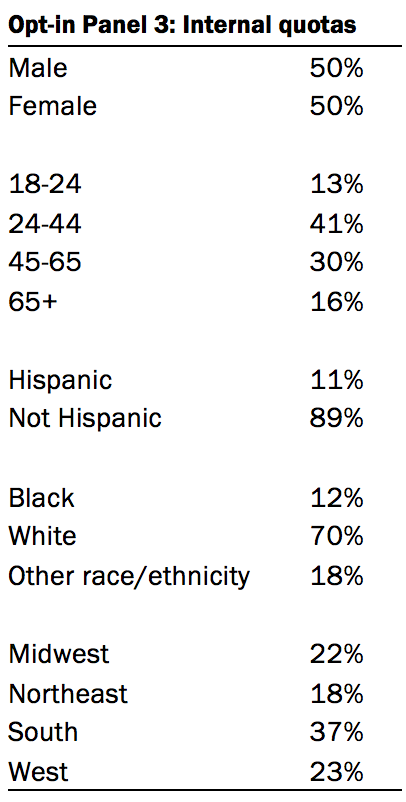
Quotas used for opt-in panel samples
The following quotas were specified and used by the opt-in survey panel vendors to produce their national samples of U.S. adults.
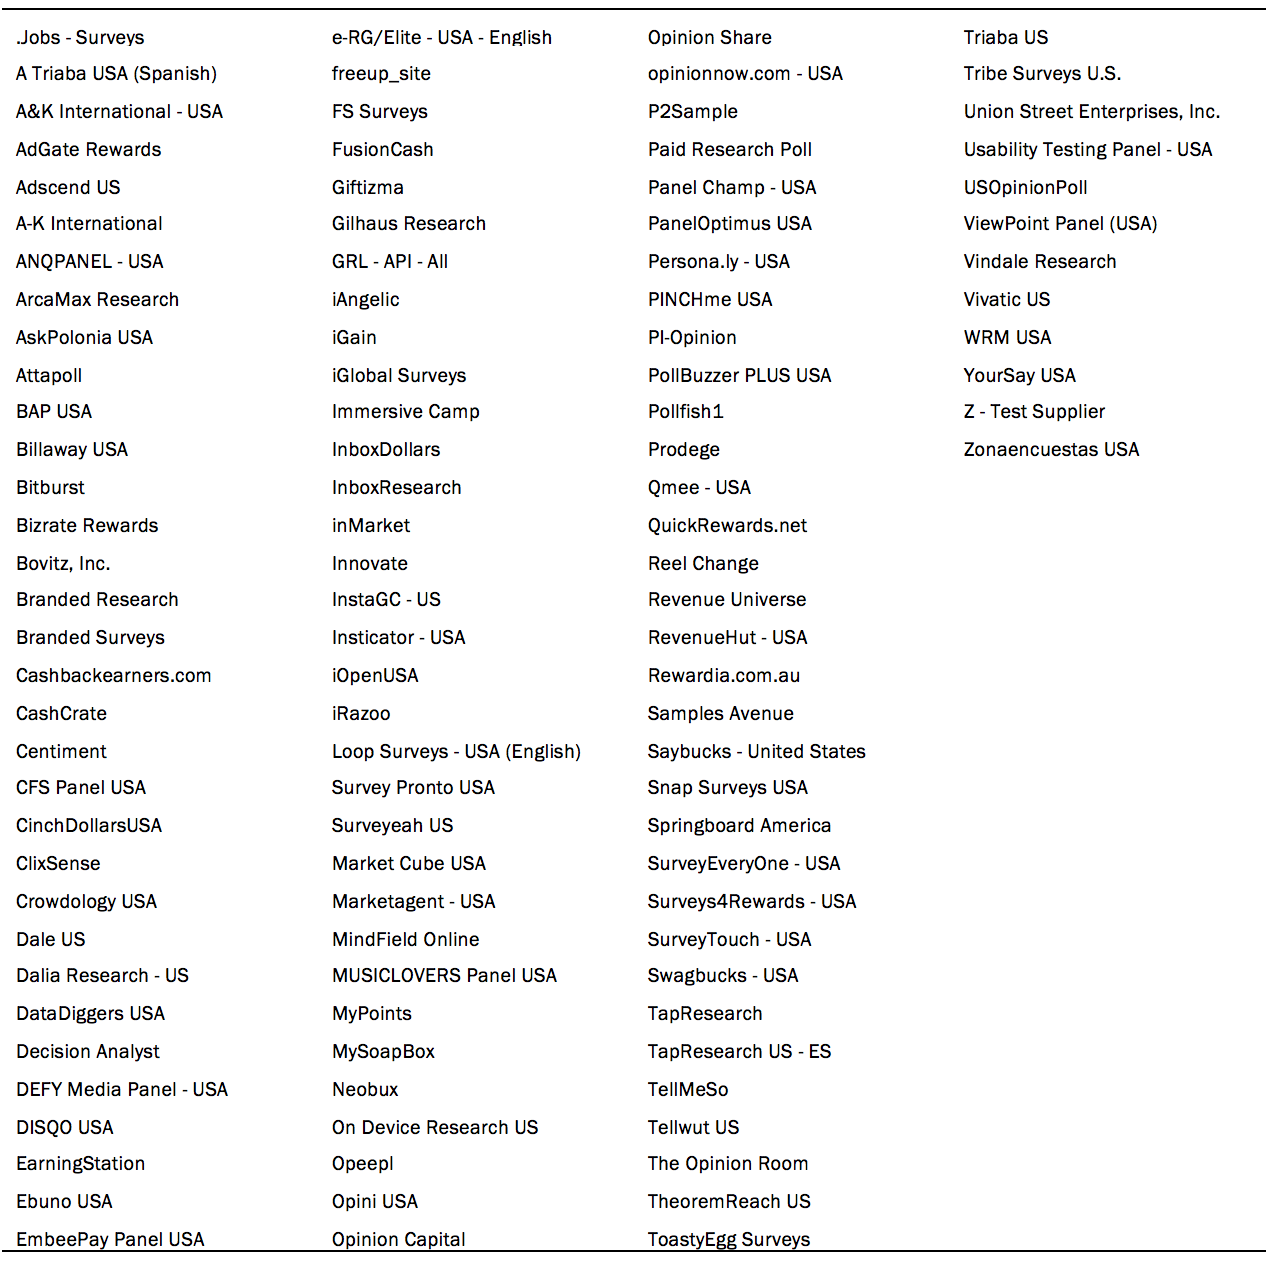
Opt-in sample third party sources
With the address-recruited panels, respondents are recruited by sampling residential addresses from the U.S. Postal Service Computerized Delivery Sequence File, and in years prior, by sampling telephone numbers using random digit dial. With the crowdsourced sample poll, the sample consists of workers on the crowdsourcing site. Two of the three opt-in survey panel vendors used third party companies, listed below (combined and de-deduplicated to avoid panel identification). One of the opt-in survey panel vendors reported using no third party companies.
Pre-testing
A pre-test with 32 interviews was conducted March 6-7, 2019 using one of the address-based panels.
Questionnaire
All six samples were administered a set of common questions. Appendix E provides the study questionnaire. There were a few questions measured for some of the samples but not others. This was because up-to-date demographic information was already on file for the address-recruited panelists but not for the opt-in panelists or crowdsourced respondents. For example, answers for sex, Hispanic ethnicity and race were measured in the study questionnaire for the opt-in respondents and measured in the most recent panel profile survey for the address-recruited respondents. Also, when the study began on March 13, 2019, it included a question asking whether respondents approved or disapproved of special counsel Robert Mueller’s investigation of Russian interference in the 2016 U.S. election. That question was dropped from the study (not asked in subsequent interviews) on March 22 when the resulting report was submitted to the Attorney General. This decision was made because after March 22, the wording of the question no longer worked; the nation’s focus shifted from “the investigation” to “the report.” All instances in which a question was administered to some respondents but not others are noted in Appendix E.
Data quality checks
One study goal was to assess data quality under several different data checking scenarios. Methods statements for public polls conducted via opt-in methods generally make no mention of data quality checks, and so it was essential that one of the scenarios feature no checking.
Standard protocol for the Center’s American Trends Panel is to review each survey dataset and remove interviews where the respondent refused to answer a large share of questions, always selected the first answer choice shown, or always selected the last answer choice shown. This cleaning process kicks out approximately 0.05% of interviews each survey. But to make the address-recruited data as comparable as possible to the opt-in data, those checks were not performed for this study.
Similarly, the other address-recruited panel has a standard set of quality checks. Once interviewing had completed, the vendor for the other address-recruited panel recommended excluding 30 of their cases due to refusing to answer 75% or more of the substantive survey questions. But again, to make the address-recruited data as comparable as possible to the opt-in data, those checks were not performed for this study.
The coordinating vendor also recommended using some of the responses collected in the survey to identify and remove low quality cases. Specifically, they recommended dropping cases that failed the attention check (COLOR); said they lived outside the US; reported an out-of-range age; indicated they are Spanish survey takers but said they couldn’t understand Spanish in the open ends; or gave nonsensical open-ended answers. These checks were not performed on the data for this study. The recommended cleaning used questions (such as “Do you currently live inside or outside the U.S.?”) were asked only because Center researchers put them in the survey; they are not commonly asked in public polls. Cleaning the datasets with the custom checks that we designed would have undercut the purpose and generalizability of the study.
Had routine quality checks been applied to the address-recruited panels, results from those sources would presumably have come out slightly better than those in the report – especially regarding item nonresponse to the open-ended questions. Similarly, to the extent that some public pollsters using opt-in sources may be performing routine quality checks, the opt-in results reported would be overly pessimistic. Chapter 4 of the report aims to provide readers with information about how well some of the most common checks perform.
Analysis of IP addresses
IP address is not included in the public dataset, as that may be considered personally identifiable information. It was, however, used in the report analysis. To obtain the geographical location of IP addresses, each IP address was compared to Classless Inter-Domain Routing (CIDR) ranges that are provided by The Internet Registry System and managed and distributed by the five Regional Internet Registries. The association of CIDR ranges to countries was used to classify respondents’ IP address country. This was done using an R package called ‘iptools’.
Following the procedure described by Ahler and colleagues, each IP address was also used to collect information from the AbuseIPDB API. For each IP address, researchers queried the API to retrieve information on usage type, the associated domain name, the internet service provider, an indicator for if an address is found on a blacklist of malicious addresses, and geographical information associated.
Usage type refers to how the IP address is used and has 11 different classifications. Usage type is classified as either Commercial, Content Delivery Network, Data Center/Web Hosting/Transit, Fixed Line ISP, Government, Library, Military, Mobile ISP, Organization, Reserved, or University/College/School. According to Ahler et al., the blacklist of malicious IP addresses is generated by AbuseIPDB users. The two primary reasons an IP address would be flagged are a website associated with the IP is caught spreading malware or engaging in phishing, or bad Internet traffic like a DDoS attack originates from the IP. Since the geographical information from the AbuseIPDB API is sourced from a different database than the source of CIDR ranges used with the iptools R package, it was used as a validation measure of placing IP addresses in countries.
Analysis with weighted data
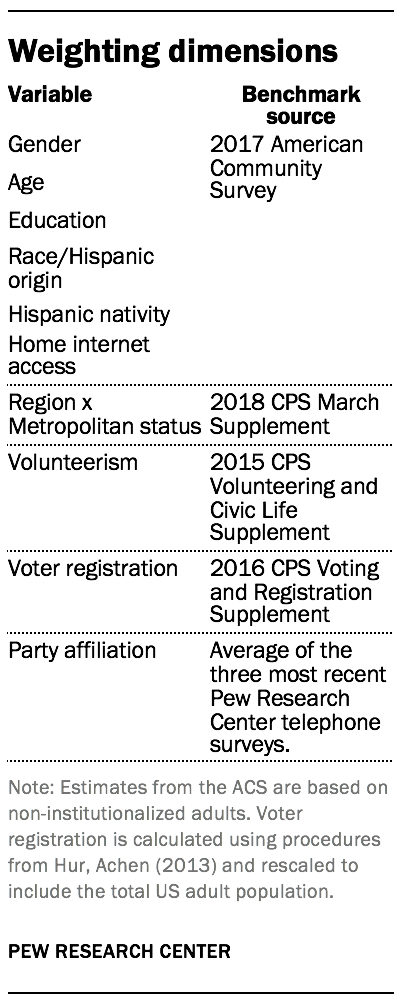
While the report analysis is based on unweighted data, researchers created a weight for each sample to assess whether the main study findings hold up when weights are applied. Each of the six samples was weighted separately. The weighting used an iterative technique called raking to align the sample with population benchmarks for U.S. adults on the dimensions listed in the accompanying table. The same raking dimensions were used for all six samples.
No base weight was available for the crowdsourced and opt-in survey panel samples, so only raking was performed. For the two address-recruited panels, the panel base weights (adjusting for differential probabilities of selection) were applied prior to the raking step, per standard practice. The weights for all six samples were trimmed separately at the 1st and 99th percentiles to reduce the variance in estimates from weighting.
The analysis found that the main patterns in the report (based on unweighted data) hold up when these weights are used. For example, the overall incidence of bogus respondents in the study is 4% with and without the weights applied. The average incidence of bogus respondents in the opt-in survey panel samples is similar with or without weighting (6% and 5%, respectively). Weighting also has little effect on the average incidence of bogus respondents in the address-recruited panel samples (1% weighted and unweighted). The share of bogus respondents passing both the attention check and the fast response check drops somewhat (from 76% to 69%) but remains a clear majority when weighting is applied.
One of the largest differences between the weighted and unweighted estimates concerns the crowdsourced sample. The share of interviews coming from bogus cases is 7% unweighted versus 4% weighted. This difference seems to stem from the fact that a very high share of bogus crowdsourced respondents report being college graduates (88%) – substantially more than the college graduate rate among bogus cases in the other samples. The severe overrepresentation of college graduates requires that, on average, the crowdsourced bogus cases get weighted down (i.e., have less influence on estimates).
Follow-up data collection
As discussed in Chapter 8, a follow-up data collection was fielded with fresh samples from opt-in panel 1 and opt-in panel 3. The purpose of this data collection was to address two important questions raised in the main study: whether the approve-of-everything response behavior was purposeful or mostly just a primacy effect and whether the fact that the opt-in panel respondents were not allowed to skip questions affected their likelihood of giving bogus data. Opt-in panel 2 was not used because in the main study all three opt-in panels performed about the same, and so including all three opt-in survey panels in the follow-up was deemed unnecessarily costly.
The follow-up survey was fielded from Dec. 2 – 7, 2019 with 10,122 interviews from opt-in panel 1 and 10,165 interviews from opt-in panel 3. Respondents to the first survey were ineligible for the follow-up study. As with the main study, the Center used a coordinating vendor, which was instructed to conduct 10,000 interviews with U.S. adults in all 50 states and the District of Columbia from each source. The survey was available in English and Spanish. The vendor was instructed to use formatting, style, and respondent sourcing that is normal for political polls conducted on each of the panels. The quotas used were the same as in the main study (reported above).
Respondents could skip any of the questions asked. In each of the samples, respondents were randomly assigned to receive survey form 1 or form 2. Form 1 displayed questions as they had been displayed in the main study, where answer choices like “approve” or “favorable” were shown first and choices like “disapprove” or “unfavorable” were shown second. Form 2 displayed all the same questions but answer choices like “disapprove” or “unfavorable” were shown first and choices like “approve” or “favorable” were shown second.
Notifications for researchers downloading the study microdata
The micro-dataset for this study is available on the Pew Research Center website. Data users should be aware of the following:
- Some open-ended answers contain emojis. In general, the emojis render in R and Microsoft Excel. They may not render properly in SPSS and possibly other survey software.
- A small number of open-ended answers were redacted because the answer appeared to contain personally identifiable information. Such answers appear in the dataset as “REDACTED [PII].”
- Some open-ended answers contain vulgar or offensive comments. As with all respondent data, inclusion by the Center does not constitute an endorsement or recommendation of any viewpoint, service or policy. Unless an answer appeared to contain personally identifiable information, the answers are left intact so that other researchers can see the raw data for themselves.


