Pew Knight Initiative
The Pew-Knight Initiative supports new research on how Americans absorb civic information, form beliefs and identities, and engage in their communities.
Pew Research Center is a nonpartisan, nonadvocacy fact tank that informs the public about the issues, attitudes and trends shaping the world. Knight Foundation is a social investor committed to supporting informed and engaged communities. Learn more >
After a prolonged decline, religion in the United States has shown signs of strength and stability in recent years.
Since 2020, steady percentages of U.S. adults have said they identify with a religion, pray daily, consider religion to be very important in their lives and attend religious services at least monthly, according to the newest Pew Research Center surveys.
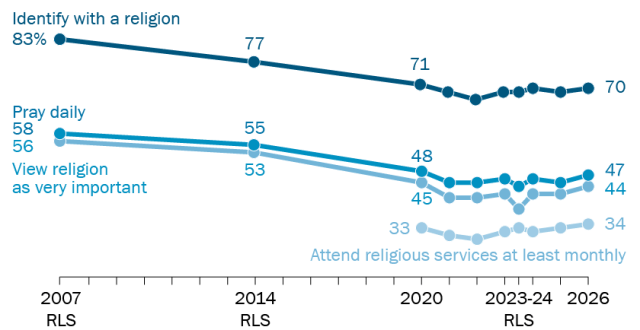
“Religion Remains Stable in the U.S., With Mixed Signals for Young Adults”
| Identify with a religion | Pray daily | View religion as very important | Attend religious services at least monthly | |
|---|---|---|---|---|
| 2007 RLS | 83 | 58 | 56 | — |
| 2014 RLS | 77 | 55 | 53 | — |
| 2020 | 71 | 48 | 45 | 33 |
| 2021 | 69 | 45 | 41 | 31 |
| 2022 | 67 | 45 | 41 | 30 |
| 2023 | 69 | 46 | 42 | 32 |
| 2023-24 RLS | 69 | 44 | 38 | 33 |
| 2024 | 70 | 46 | 42 | 32 |
| 2025 | 69 | 45 | 42 | 33 |
| 2026 | 70 | 47 | 44 | 34 |
“Religion Remains Stable in the U.S., With Mixed Signals for Young Adults”
And the percentage of Americans who say they went to religious services in the last month continues to climb following a pandemic-era low point.
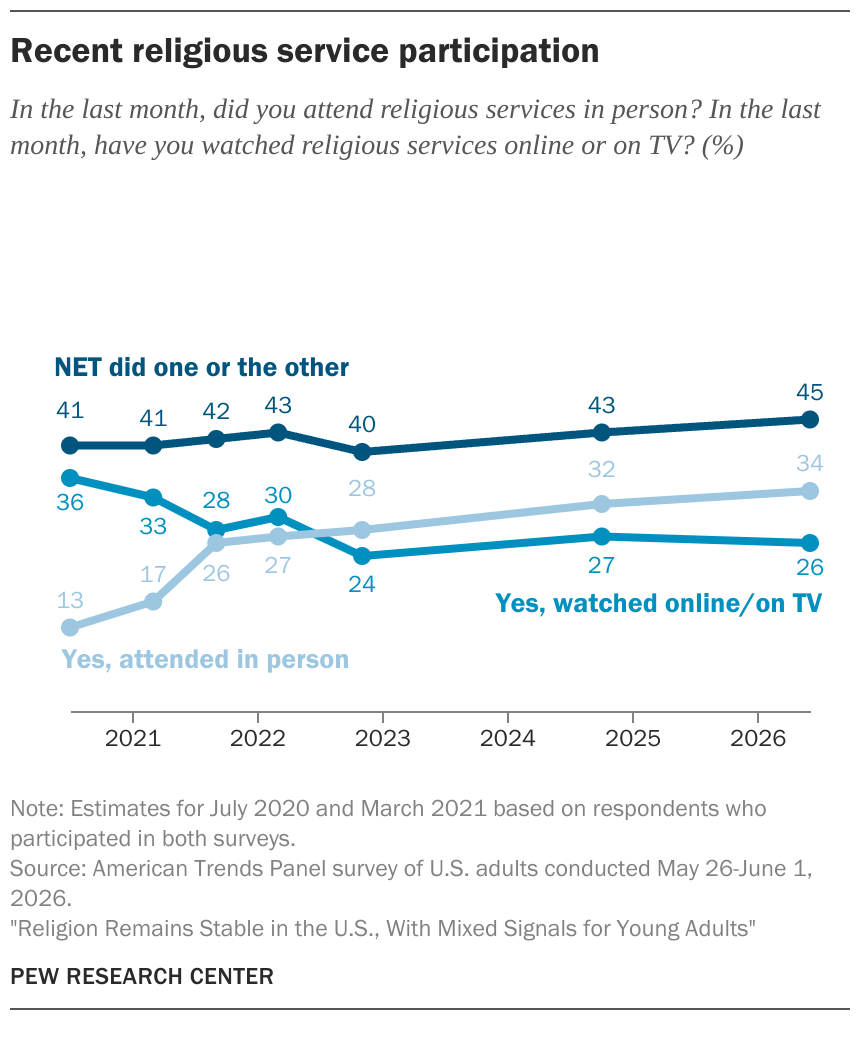
“Religion Remains Stable in the U.S., With Mixed Signals for Young Adults”
| NET did one or the other | Yes, watched online/on TV | Yes, attended in person | |
|---|---|---|---|
| 7/2020 | 41 | 36 | 13 |
| 3/2021 | 41 | 33 | 17 |
| 9/2021 | 42 | 28 | 26 |
| 3/2022 | 43 | 30 | 27 |
| 11/2022 | 40 | 24 | 28 |
| 10/2024 | 43 | 27 | 32 |
| 6/2026 | 45 | 26 | 34 |
“Religion Remains Stable in the U.S., With Mixed Signals for Young Adults”
In a June 2026 survey, 34% of U.S. adults say “yes” when asked whether they went to religious services in person during the last month, and a total of 45% say they either attended religious services in person or watched them online or on TV in the last month. Both numbers are at their highest levels since the Center started asking these questions in July 2020, during the early months of the COVID-19 outbreak.1
Related: How Americans Are Engaged With News, Politics, Religion and Civic Life
These new findings come amid media reports suggesting that a religious resurgence might be underway among young U.S. adults, especially young conservative men.
The Center’s latest surveys contain mixed signals about what is happening among young adults.
“Religion Remains Stable in the U.S., With Mixed Signals for Young Adults”
| Young adults, born 2004-08 (now roughly ages 18-22) | Young adults, born 2000-03 (now roughly ages 23-26) | Older adults, born in 1990s or earlier | Lower bound of confidence interval, Young adults, born 2004-08 | Upper bound of confidence interval, Young adults, born 2004-08 | Lower bound of confidence interval, Young adults, born 2000-03 | Upper bound of confidence interval, Young adults, born 2000-03 | Lower bound of confidence interval, Older adults | Upper bound of confidence interval, Older adults | |
|---|---|---|---|---|---|---|---|---|---|
| Attend religious services at least monthly | 41 | 27 | 33 | 35.2 | 46.4 | 22.2 | 31.8 | 31.8 | 33.8 |
| Pray daily | 34 | 26 | 48 | 28.9 | 39.7 | 21.2 | 30.8 | 46.6 | 48.8 |
| View religion as very important | 36 | 27 | 44 | 30.0 | 41.0 | 22.3 | 31.9 | 43.3 | 45.5 |
| Identify with a religion | 59 | 50 | 71 | 53.1 | 64.3 | 44.8 | 55.6 | 70.4 | 72.4 |
“Religion Remains Stable in the U.S., With Mixed Signals for Young Adults”
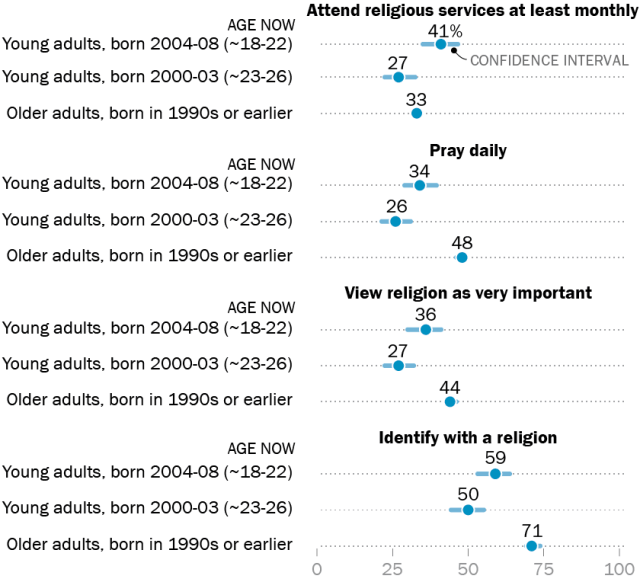
On the one hand, as the very youngest adults (born from 2004 to 2008, now roughly ages 18 to 22) come of age, they are reporting relatively high rates of attendance at religious services. Overall, 41% say they go to services at a church, synagogue, mosque or other house of worship at least once or twice a month, which is higher than in the U.S. public as a whole (33%).
On the other hand, young adults who are only slightly older (born from 2000 to 2003, now roughly 23 to 26) are the least religious age group when it comes to how often they pray, how important religion is in their lives and how many of them identify with a religion. And the share who say they attend religious services at least monthly (27%) is among the lowest of any age group.
The youngest adults (ages 18 to 22) are no more religious today than young adults in this age range were in 2014. And young adults between 23 and 26 today are less religious than people in this age range were in 2014. People in both of these young age categories are significantly less religious than young adults of the same ages were in 2007, roughly two decades ago.2
In addition, there is no clear evidence in Pew Research Center surveys that any birth cohort of Americans that can be tracked over time has become more religious in recent years. Since our recent surveys include only people 18 and older, we don’t know how religious the 2004-08 birth cohort was a few years ago, when its members were still minors. But all the preceding birth cohorts have been fairly stable over the last six years.
When it comes to religion and politics among young adults, the youngest Republicans report attending religious services more often than the youngest Democrats, which is not unusual.3
Additionally, the youngest Republicans attend religious services at fairly high rates compared with older Republicans. But they are not solely responsible for the high levels of religious attendance among the youngest adults. The youngest Democrats also attend services at relatively high rates compared with Democrats in some older age groups.
In the Center’s recent surveys, the youngest men report attending religious services more often than the youngest women. This is something we have not seen before in our surveys. In the past, American women have tended to be more religious than American men.
Yet the youngest women also say they go to services at relatively high rates, compared with women in the immediately preceding age groups.
A complicated picture of religion among young adults
In sum, recent Pew Research Center surveys paint a complicated picture of religion among young U.S. adults. The youngest (roughly ages 18 to 22) stand out as especially religious in one respect – their self-reported rate of attendance at religious services. But they are less distinctive in other ways, such as their rates of religious affiliation and how often they say they pray.
Higher religious attendance is especially evident among young men and young Republicans, but it is not limited to these groups. And young adults roughly ages 23 to 26 – today’s second-youngest adults – are among the least religious cohorts we have seen in our surveys.
Moreover, this is not the first time in recent decades that surveys have shown the youngest Americans entering adulthood with relatively high rates of religiousness. When this has happened in the past, the religiousness of the youngest adults has tended to fade with time, leaving them less religious than people in the preceding birth cohort.4 We have no way of knowing whether today’s youngest adults will follow that pattern or break it.
Historically, a major driver of long-term declines in American religion has been cohort replacement – the gradual passing away of older generations of adults, who have tended to be more religious, and the coming of age of younger adults who have been less religious, on average, than their parents and grandparents.5 This is one reason why it is important to pay attention to what is happening with religion among young people.
But Americans who have just recently become adults are a difficult group to study in surveys. Some still live in their childhood homes. Others have left home for college, and still others have joined the workforce and set off on their own. They can be hard to reach in surveys. And if the surveys don’t get a representative mix of young adults, then the findings may be biased.6
Furthermore, since the nation’s youngest adults make up a relatively small share of the country’s population, they also make up a small share of our survey respondents. Overall, the Center’s aggregated 2025-26 surveys used in this analysis include a total of 443 respondents who were born between 2004 and 2008, and who are roughly between the ages of 18 and 22 today. The margin of error for this group is plus or minus 5.7 percentage points.
The size of the sample gets even smaller, and the margin of error gets even larger, when the youngest group is divided into subcategories like men and women, or Republicans and Democrats.
Additionally, researchers are still measuring and trying to understand the impact of the COVID-19 pandemic. Comparisons across many national surveys suggest that heightened levels of religiousness among young people may reflect a rebound from the pandemic.7
For all these reasons, it’s prudent to take a long view. Scholars of religion tend to study religious change over decades. Time will tell whether the relatively high religiousness of today’s youngest adults is a turning point or a blip in the data.
In the meantime, the rest of this analysis provides a closer look at recent trends in U.S. religion, with a focus on what is happening among young people.
Skip ahead to read about:
- How young adults compare with older adults today
- How the religiousness of U.S. adults has changed over recent years
- How the gender gap in American religion is changing
- How the religiousness of young Republicans compares with young Democrats
- What surveys by other organizations show about religion among young Americans
How young adults compare with older adults today
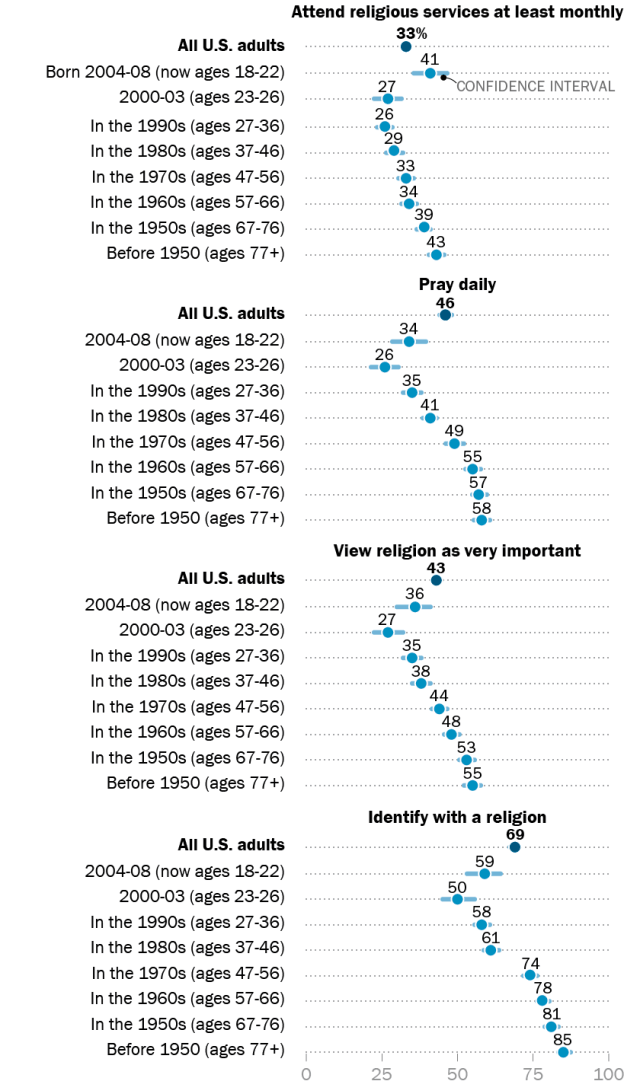
For this analysis of religion among young adults, we focus on people born in the 2000s, now ages 18 to 26. We further divide this group roughly in half, because the estimates for the youngest subset (born between 2004 and 2008, now roughly ages 18 to 22) are quite different from the estimates for the slightly older subset (born 2000-03, now roughly 23 to 26).
Today, 41% of adults ages 18 to 22 say they attend religious services at least once or twice a month, which is higher than among adults born in the 1990s, 1980s, 1970s and 1960s.
By contrast, religious service attendance among young adults ages 23 to 26 is among the lowest of any age group in the U.S. population. About a quarter (27%) say they attend services at a church, synagogue, mosque or other house of worship at least monthly.
“Religion Remains Stable in the U.S., With Mixed Signals for Young Adults”
| Attend religious services at least monthly | Pray daily | View religion as very important | Identify with a religion | Lower bound of confidence interval, Attend religious services | Upper bound of confidence interval, Attend religious services | Lower bound of confidence interval, Pray daily | Upper bound of confidence interval, Pray daily | Lower bound of confidence interval, View religion as very important | Upper bound of confidence interval, View religion as very important | Lower bound of confidence interval, Identify with a religion | Upper bound of confidence interval, Identify with a religion | |
|---|---|---|---|---|---|---|---|---|---|---|---|---|
| All U.S. adults | 33 | 46 | 43 | 69 | 32.0 | 34.0 | 44.4 | 46.6 | 41.8 | 44.0 | 68.2 | 70.2 |
| Born 2004-08 (now roughly ages 18-22) | 41 | 34 | 36 | 59 | 35.2 | 46.4 | 28.9 | 39.7 | 30.0 | 41.0 | 53.1 | 64.3 |
| 2000-03 (ages 23-26) | 27 | 26 | 27 | 50 | 22.2 | 31.8 | 21.2 | 30.8 | 22.3 | 31.9 | 44.8 | 55.6 |
| In the 1990s (ages 27-36) | 26 | 35 | 35 | 58 | 23.5 | 28.5 | 31.8 | 37.2 | 32.7 | 38.1 | 55.4 | 61.0 |
| In the 1980s (ages 37-46) | 29 | 41 | 38 | 61 | 26.7 | 31.5 | 37.9 | 43.1 | 35.5 | 40.7 | 58.8 | 64.0 |
| In the 1970s (ages 47-56) | 33 | 49 | 44 | 74 | 30.4 | 35.4 | 46.0 | 51.4 | 41.8 | 47.2 | 71.9 | 76.5 |
| In the 1960s (ages 57-66) | 34 | 55 | 48 | 78 | 31.8 | 36.2 | 52.5 | 57.1 | 46.0 | 50.8 | 76.3 | 80.1 |
| In the 1950s (ages 67-76) | 39 | 57 | 53 | 81 | 36.4 | 41.0 | 55.0 | 59.6 | 50.6 | 55.2 | 79.0 | 82.6 |
| Before 1950 (roughly ages 77+) | 43 | 58 | 55 | 85 | 40.3 | 45.7 | 55.6 | 61.0 | 52.1 | 57.5 | 83.6 | 87.4 |
“Religion Remains Stable in the U.S., With Mixed Signals for Young Adults”
Today’s youngest adults do not stand out as much when it comes to how often they pray, how important they say religion is in their lives or whether they identify with a religion.
On all three of these measures, the youngest adults (roughly ages 18 to 22) report higher levels of religiousness than the second-youngest adults (roughly 23 to 26).8 But the youngest adults tend to be less religious on these other measures than are many older cohorts and the overall U.S. public.
And the second-youngest adults are the least religious age group on all core measures of religiousness.
How the religiousness of U.S. adults has changed over recent years
We have no clear evidence that any birth cohort we can track over time has become more religious in recent years.
“Religion Remains Stable in the U.S., With Mixed Signals for Young Adults”
| 2022 | 2023 | 2023-24 | 2024 | 2025 | 2026 | 2022-Lower bound | 2022-Upper bound | 2023- Lower bound | 2023- Upper bound | 2023-24 Lower bound | 2023-24 Upper bound | 2024- Lower bound | 2024- Upper bound | 2025- Lower bound | 2025- Upper bound | 2026- Lower bound | 2026- Upper bound | |
|---|---|---|---|---|---|---|---|---|---|---|---|---|---|---|---|---|---|---|
| Attend services at least monthly | 14 | 16 | 22 | 32 | 28 | 25 | 5.9 | 21.9 | 9.1 | 23.1 | 18.8 | 25.4 | 22.3 | 42.1 | 22.1 | 34.5 | 16.9 | 32.1 |
| Pray daily | 25 | 18 | 26 | 34 | 26 | 26 | 14.7 | 34.7 | 10.4 | 24.8 | 22.4 | 29.4 | 23.6 | 43.6 | 19.9 | 31.9 | 18.3 | 33.9 |
| View religion as very important | 22 | 23 | 25 | 35 | 28 | 26 | 12.3 | 31.3 | 14.6 | 30.6 | 21.8 | 28.8 | 24.6 | 44.8 | 21.6 | 33.8 | 18.3 | 33.9 |
| Identify with a religion | 43 | 50 | 53 | 64 | 51 | 49 | 31.1 | 53.9 | 40.1 | 59.1 | 48.9 | 56.9 | 53.4 | 73.8 | 43.8 | 57.4 | 40.3 | 58.1 |
“Religion Remains Stable in the U.S., With Mixed Signals for Young Adults”
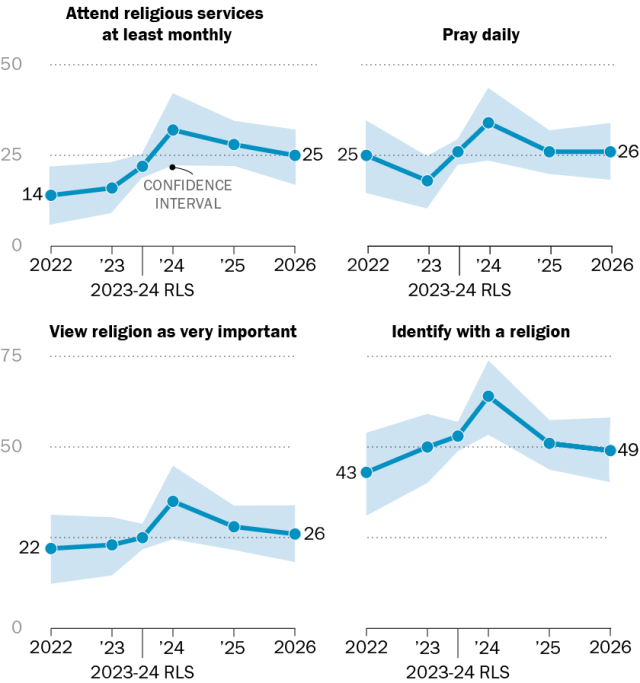
The youngest group we can track is young adults born between 2000 and 2003, who are roughly ages 23 to 26 today.
We can observe this group as far back as 2022 in our surveys. But many of the data points are based on small samples of less than 200 respondents. This means that the estimates are volatile and can bounce around from year to year without signaling any real, statistically significant change.
In recent years, religious attendance has been slightly higher among the 2000-03 birth cohort than it was in 2022. The 2022 reading may reflect a pandemic-era low point in religious attendance among members of this group.9
All the other indicators show no notable change in either direction. Estimates vary from year to year, but the percentages of people who say they pray daily, that religion is very important to them and that they identify with a religion are all about the same today as in 2022.10
“Religion Remains Stable in the U.S., With Mixed Signals for Young Adults”
| 2020 | 2021 | 2022 | 2023 | 2023-24 | 2024 | 2025 | 2026 | Lower bound of confidence interval, 2020 | Upper bound of confidence interval, 2020 | Lower bound of confidence interval, 2021 | Upper bound of confidence interval, 2021 | Lower bound of confidence interval, 2022 | Upper bound of confidence interval, 2022 | Lower bound of confidence interval, 2023 | Upper bound of confidence interval, 2023 | Lower bound of confidence interval, 2023-24 | Upper bound of confidence interval, 2023-24 | Lower bound of confidence interval, 2024 | Upper bound of confidence interval, 2024 | Lower bound of confidence interval, 2025 | Upper bound of confidence interval, 2025 | Lower bound of confidence interval, 2026 | Upper bound of confidence interval, 2026 | |
|---|---|---|---|---|---|---|---|---|---|---|---|---|---|---|---|---|---|---|---|---|---|---|---|---|
| Attend services at least monthly | 26 | 24 | 28 | 22 | 24 | 24 | 25 | 27 | 21.1 | 31.5 | 19.0 | 30.0 | 23.0 | 33.4 | 17.7 | 26.3 | 22.6 | 26.2 | 19.5 | 28.1 | 22.3 | 28.5 | 22.8 | 31.2 |
| Pray daily | 33 | 32 | 35 | 32 | 31 | 30 | 33 | 38 | 27.6 | 38.8 | 26.1 | 38.1 | 29.5 | 40.5 | 26.6 | 36.4 | 29.6 | 33.4 | 25.9 | 35.1 | 29.5 | 36.3 | 33.0 | 42.2 |
| View religion as very important | 31 | 31 | 36 | 30 | 29 | 32 | 34 | 39 | 25.6 | 36.6 | 24.8 | 36.8 | 30.4 | 41.4 | 24.9 | 34.5 | 27.0 | 30.6 | 27.7 | 37.1 | 30.1 | 36.9 | 34.1 | 43.3 |
| Identify with a religion | 58 | 53 | 58 | 55 | 55 | 53 | 57 | 60 | 52.2 | 64.0 | 46.9 | 59.7 | 52.2 | 63.6 | 49.4 | 59.8 | 52.7 | 56.7 | 48.2 | 58.2 | 53.7 | 60.9 | 55.0 | 64.4 |
“Religion Remains Stable in the U.S., With Mixed Signals for Young Adults”
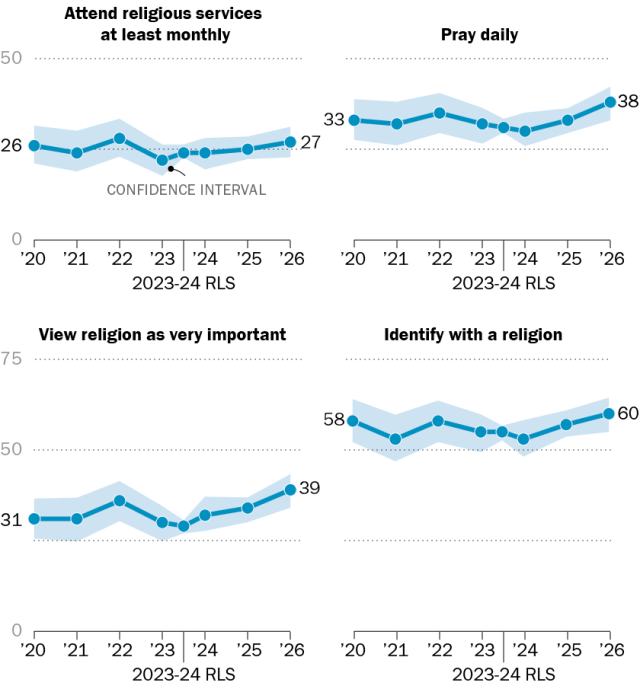
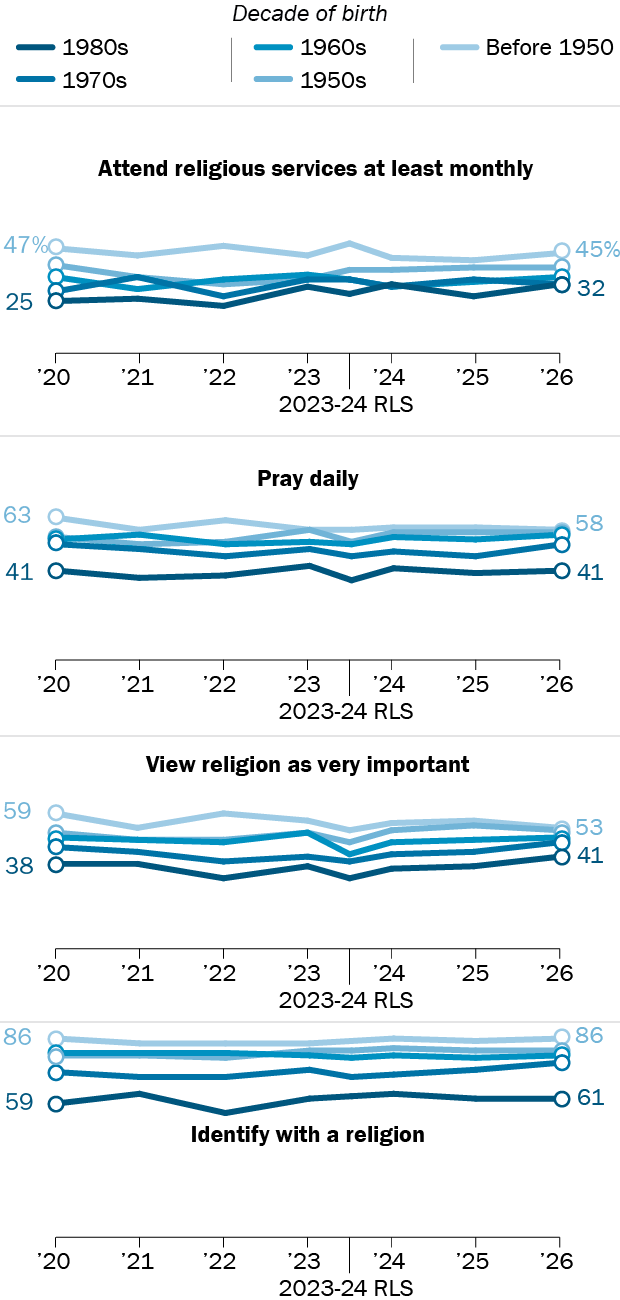
The next youngest cohort – people born in the 1990s, who are roughly 27 to 36 today – can be tracked back to 2020. Compared with 2020, people in this group are now somewhat more likely to say religion is very important in their lives.
But on the study’s other indicators of religiousness, the recent data shows more stability than change, with no clear evidence of either religious growth or decline.
“Religion Remains Stable in the U.S., With Mixed Signals for Young Adults”
| Attend religious services at least monthly, among people who were born … | ||||||||
|---|---|---|---|---|---|---|---|---|
| 2020 | 2021 | 2022 | 2023 | 2023-24 | 2024 | 2025 | 2026 | |
| 1980s | 25 | 26 | 23 | 31 | 28 | 32 | 27 | 32 |
| 1970s | 29 | 35 | 27 | 34 | 34 | 31 | 34 | 32 |
| 1960s | 35 | 30 | 34 | 36 | 34 | 31 | 33 | 35 |
| 1950s | 40 | 35 | 32 | 34 | 38 | 38 | 39 | 39 |
| Before 1950 | 47 | 44 | 48 | 44 | 49 | 43 | 42 | 45 |
| Pray daily, among people who were born … | ||||||||
| 1980s | 41 | 38 | 39 | 43 | 37 | 42 | 40 | 41 |
| 1970s | 52 | 50 | 47 | 50 | 47 | 49 | 47 | 52 |
| 1960s | 54 | 56 | 52 | 53 | 52 | 55 | 54 | 56 |
| 1950s | 55 | 52 | 53 | 58 | 53 | 57 | 57 | 57 |
| Before 1950 | 63 | 58 | 62 | 58 | 58 | 59 | 59 | 58 |
| View religion as very important, among people who were born… | ||||||||
| 1980s | 38 | 38 | 32 | 37 | 32 | 36 | 37 | 41 |
| 1970s | 45 | 43 | 39 | 41 | 39 | 42 | 43 | 47 |
| 1960s | 49 | 48 | 47 | 51 | 42 | 47 | 48 | 49 |
| 1950s | 51 | 48 | 48 | 51 | 47 | 52 | 54 | 52 |
| Before 1950 | 59 | 53 | 59 | 56 | 52 | 55 | 56 | 53 |
| Identify with a religion, among people who were born … | ||||||||
| 1980s | 59 | 63 | 55 | 61 | 62 | 63 | 61 | 61 |
| 1970s | 72 | 70 | 70 | 73 | 70 | 71 | 73 | 76 |
| 1960s | 80 | 80 | 80 | 79 | 78 | 79 | 78 | 79 |
| 1950s | 79 | 79 | 78 | 81 | 81 | 82 | 81 | 81 |
| Before 1950 | 86 | 84 | 84 | 84 | 85 | 86 | 85 | 86 |
“Religion Remains Stable in the U.S., With Mixed Signals for Young Adults”
A similar pattern appears for older cohorts. In general there is no indication that respondents born in the 1980s or earlier have become significantly more religious or less religious in recent years.
We also conducted an analysis of religious change over time using longitudinal data from our American Trends Panel surveys. Longitudinal analyses look at the same survey respondents at different points in time.
In this case, we compared how 5,835 U.S. adults answered religion questions in 2020 with how the same people answered the same questions in 2025. The analysis shows no clear signs of growing or declining religiousness in any birth cohort. For detailed findings from the analysis, read “Most Americans’ Religious Lives Haven’t Changed Much in Recent Years.”
How the gender gap in American religion is changing
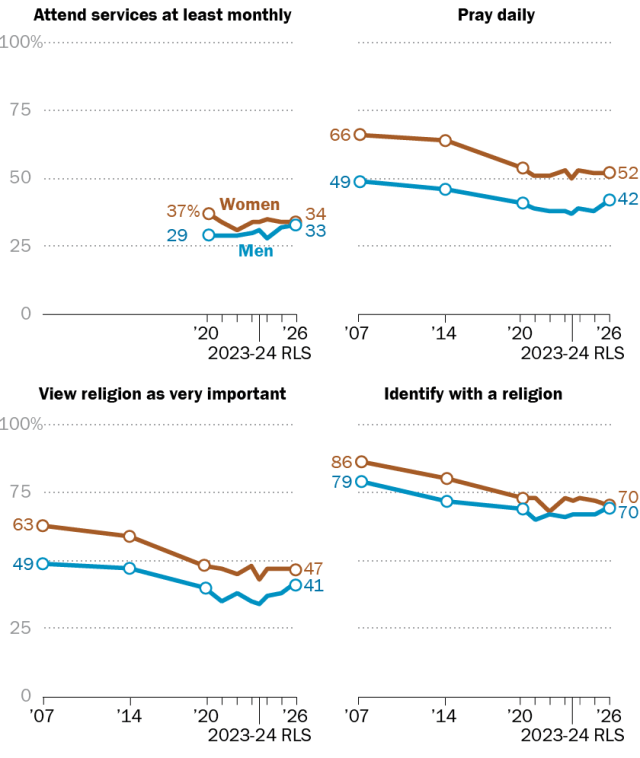
Historically, going back decades in surveys, women have been more religious than men in the United States. That’s still true today, at least when it comes to prayer frequency and the importance people attach to religion in their lives.11 But the differences are less stark than they used to be.
For instance, when the Center first conducted the Religious Landscape Study (RLS) in 2007, the percentage of people who said religion was very important in their lives was 14 percentage points higher among women than men. By the time of the Center’s 2023-24 RLS, the gap had shrunk to 9 points. In the 2026 NPORS, it stands at 6 points.
The long-term narrowing of the gender gap in the percentage of people who pray regularly, say religion is very important to them and identify with a religion is not caused by an increase in the religiousness of men. Rather, both women and men in the U.S. have become less religious over time by these measures, with women’s religious engagement declining more.
“Religion Remains Stable in the U.S., With Mixed Signals for Young Adults”
| Attend religious services at least monthly | ||||||||||
|---|---|---|---|---|---|---|---|---|---|---|
| 2007 | 2014 | 2020 | 2021 | 2022 | 2023 | 2023-24 | 2024 | 2025 | 2026 | |
| Women | — | — | 37 | 34 | 31 | 34 | 34 | 35 | 34 | 34 |
| Men | — | — | 29 | 29 | 29 | 30 | 31 | 28 | 32 | 33 |
| Pray daily | ||||||||||
| Women | 66 | 64 | 54 | 51 | 51 | 53 | 50 | 53 | 52 | 52 |
| Men | 49 | 46 | 41 | 39 | 38 | 38 | 37 | 39 | 38 | 42 |
| View religion as very important | ||||||||||
| Women | 63 | 59 | 48 | 47 | 45 | 48 | 43 | 47 | 47 | 47 |
| Men | 49 | 47 | 40 | 35 | 38 | 35 | 34 | 37 | 38 | 41 |
| Identify with a religion | ||||||||||
| Women | 86 | 80 | 73 | 73 | 68 | 73 | 72 | 73 | 72 | 70 |
| Men | 79 | 72 | 69 | 65 | 67 | 66 | 67 | 67 | 67 | 70 |
“Religion Remains Stable in the U.S., With Mixed Signals for Young Adults”
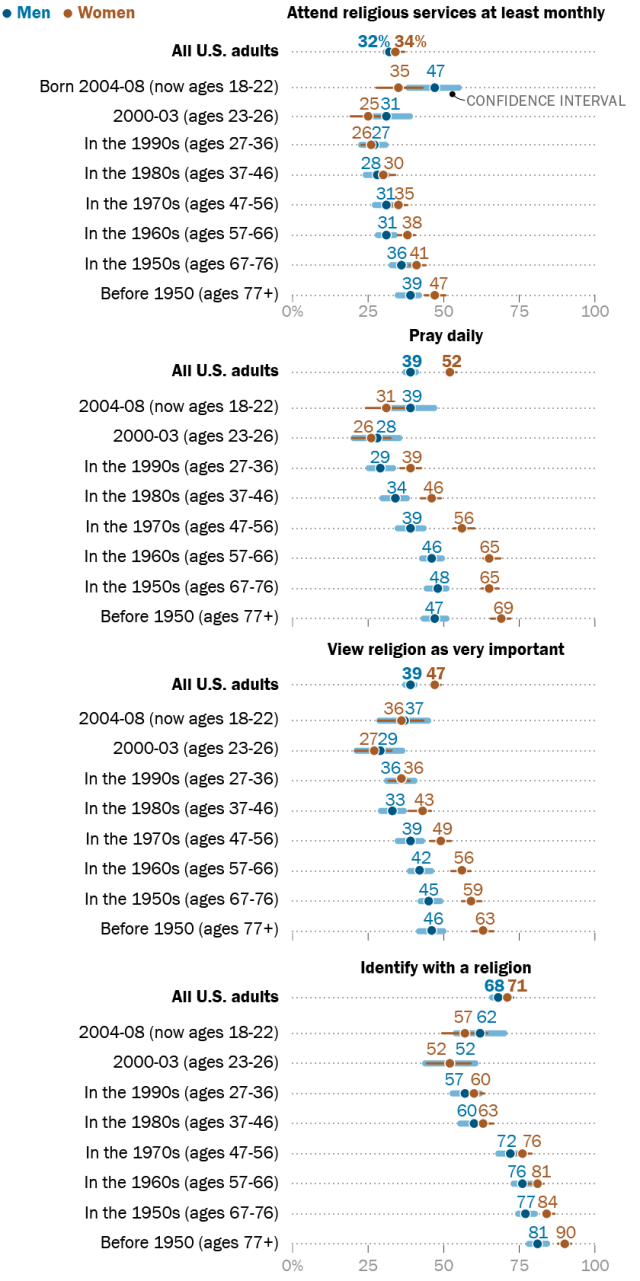
The data show, furthermore, that the gender gap in religion is much smaller among young adults born in the 2000s than it is among older people born in the 1960s or earlier.
In our most recent surveys, the youngest men report attending religious services at higher rates than the youngest women. Additionally, the youngest men report attending religious services at significantly higher rates than almost all older age groups of men.12
The youngest women also report attending religious services at fairly high rates, compared with older women. The 35% of the youngest women (born from 2004 to 2008, now roughly ages 18 to 22) who say they go to services at least monthly is higher than among women born in the 1990s and early 2000s, and roughly on par with women born from the 1950s through the 1980s.
So, although the relatively high rate of religious attendance among the youngest men is noteworthy, men alone are not responsible for the elevated religious service attendance we see among the youngest U.S. adults.
Both the youngest men and the youngest women look less distinctive compared with their elders on our other core measures of religiousness. The youngest men and women say they pray daily, that religion is very important in their lives and that they identify with a religion at rates that roughly match or exceed their slightly older predecessors (born between 2000 and 2003). But these slightly older adults, currently ages 23 to 26, have especially low levels of religiousness. On these measures, the youngest men and women appear less religious than several older age groups.
“Religion Remains Stable in the U.S., With Mixed Signals for Young Adults”
| Men, Attend religius services at least monthly | Women, Attend religious services at least monthly | Men, Pray daily | Women, Pray daily | Men, View religion as very important | Women, View religion as very important | Men, Identify with a religion | Women, Identify with a religion | Lower bound of confidence interval, Men, Attend religious services at least monthly | Upper bound of confidence interval, Men, attend religious services at least monthly | Lower bound of confidence interval, Women, Attend religious services at least monthly | Upper bound of confidence interval, Women, attend religious services at least monthly | Lower bound of confidence interval, Men, Pray daily | Upper bound of confidence interval, Men, Pray daily | Lower bound of confidence interval, Women, Pray daily | Upper bound of confidence interval, Women, Pray daily | Lower bound of confidence interval, Men, View religion as very important | Upper bound of confidence interval, Men, View religion as very important | Lower bound of confidence interval, Women, View religion as very important | Upper bound of confidence interval, Women, View religion as very important | Lower bound of confidence interval, Men, Identify with a religion | Upper bound of confidence interval, Men, Identify with a religion | Lower bound of confidence interval, Women, Identify with a religion | Upper bound of confidence interval, Women, Identify with a religion | |
|---|---|---|---|---|---|---|---|---|---|---|---|---|---|---|---|---|---|---|---|---|---|---|---|---|
| All U.S. adults | 32 | 34 | 39 | 52 | 39 | 47 | 68 | 71 | 30.5 | 33.7 | 33.1 | 35.7 | 37.4 | 40.6 | 50.6 | 53.4 | 37.2 | 40.4 | 45.7 | 48.5 | 66.2 | 69.4 | 70.1 | 72.7 |
| Born 2004-08 (now roughly ages 18-22) | 47 | 35 | 39 | 31 | 37 | 36 | 62 | 57 | 38.4 | 55.2 | 27.9 | 42.7 | 30.5 | 46.9 | 23.9 | 38.1 | 29.2 | 45.4 | 28.2 | 43.0 | 53.9 | 70.3 | 49.5 | 64.7 |
| 2000-03 (ages 23-26) | 31 | 25 | 28 | 26 | 29 | 27 | 52 | 52 | 23.1 | 38.9 | 19.1 | 31.3 | 20.2 | 35.6 | 19.9 | 32.3 | 21.2 | 36.8 | 20.6 | 33.0 | 43.6 | 60.8 | 44.8 | 58.8 |
| In the 1990s (ages 27-36) | 27 | 26 | 29 | 39 | 36 | 36 | 57 | 60 | 22.5 | 30.7 | 22.9 | 29.3 | 25.1 | 33.5 | 35.3 | 42.5 | 31.2 | 40.2 | 32.0 | 39.0 | 52.8 | 62.0 | 56.2 | 63.4 |
| In the 1980s (ages 37-46) | 28 | 30 | 34 | 46 | 33 | 43 | 60 | 63 | 23.8 | 31.4 | 27.3 | 33.5 | 29.7 | 37.7 | 42.5 | 49.3 | 28.9 | 36.9 | 39.2 | 46.0 | 55.6 | 63.8 | 59.7 | 66.3 |
| In the 1970s (ages 47-56) | 31 | 35 | 39 | 56 | 39 | 49 | 72 | 76 | 26.9 | 34.7 | 31.5 | 38.1 | 34.9 | 43.3 | 53.0 | 59.8 | 34.6 | 42.8 | 45.5 | 52.3 | 67.8 | 75.4 | 73.5 | 79.3 |
| In the 1960s (ages 57-66) | 31 | 38 | 46 | 65 | 42 | 56 | 76 | 81 | 28.0 | 34.4 | 34.5 | 40.5 | 42.6 | 49.6 | 62.6 | 68.4 | 38.9 | 45.9 | 52.5 | 58.7 | 73.1 | 79.1 | 78.2 | 83.0 |
| In the 1950s (ages 67-76) | 36 | 41 | 48 | 65 | 45 | 59 | 77 | 84 | 32.6 | 39.2 | 38.0 | 44.2 | 44.3 | 51.3 | 62.2 | 68.2 | 42.0 | 48.8 | 56.2 | 62.4 | 74.4 | 80.2 | 81.8 | 86.4 |
| Before 1950 (roughly ages 77+) | 39 | 47 | 47 | 69 | 46 | 63 | 81 | 90 | 34.7 | 42.5 | 43.5 | 50.9 | 43.0 | 51.0 | 65.3 | 72.1 | 41.9 | 49.9 | 59.5 | 66.7 | 77.8 | 84.0 | 87.7 | 92.1 |
“Religion Remains Stable in the U.S., With Mixed Signals for Young Adults”
How the religiousness of young Republicans and young Democrats compare
Some observers have hypothesized that any religious upsurge taking place among young adults could be connected to politics. Perhaps involvement with religion is especially appealing to young conservatives and Republicans, they suggest.
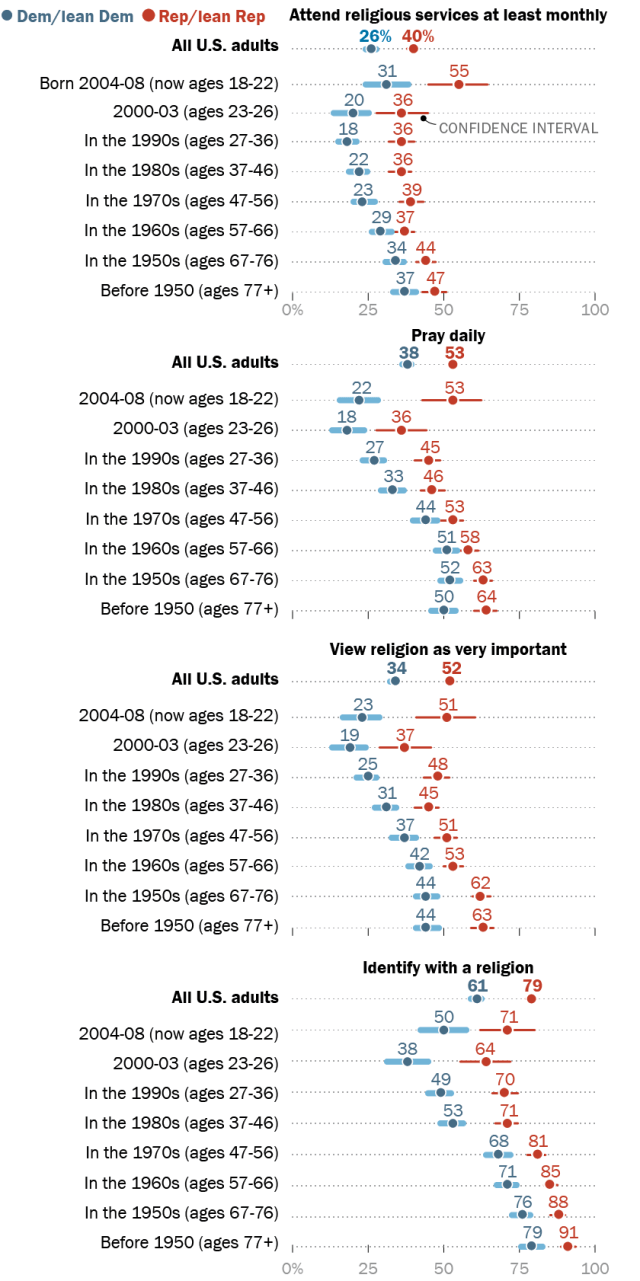
Among the youngest adults, Republicans and those who lean toward the Republican Party are substantially more religious than Democrats and Democratic leaners. Republicans are also more religious than Democrats in every older age group, but the gaps between the youngest Republicans and Democrats tend to be larger than among some older age groups, at least on some measures.
Additionally, the youngest Republicans attend religious services at high rates compared with older Republicans: 55% of the youngest Republicans say they attend services at least monthly, which is more than in any other age group of Republicans except the very oldest.13
But the youngest Democrats also report attending services at relatively high rates compared with other Democrats. Regular religious attendance is more common among the youngest Democrats (born between 2004 and 2008, now roughly 18 to 22) than it is among Democrats born from the 1970s through the early 2000s, and about the same as among older Democrats born in the 1960s or earlier.
So we cannot conclude that the relatively high attendance rate of young adults is an exclusively Republican phenomenon. Both the youngest Republicans and youngest Democrats report attending religious services at relatively high rates compared with older people who share their partisan orientation.
The percentage of the youngest Republicans who say they pray regularly and that religion is very important in their lives is on par with the share of Republicans as a whole who say these things. By contrast, the youngest Democrats say they pray daily and that religion is very important in their lives at lower rates than among Democrats as a whole.
And both the youngest Republicans and youngest Democrats identify with a religion at below-average rates when compared with people of all ages within their respective parties.
“Religion Remains Stable in the U.S., With Mixed Signals for Young Adults”
| Rep/lean Rep, Attend religius services at least monthly | Dem/lean Dem, Attend religious services at least monthly | Rep/lean Rep, Pray daily | Dem/lean Dem, Pray daily | Rep/lean Rep, View religion as very important | Dem/lean Dem, View religion as very important | Rep/lean Rep, Identify with a religion | Dem/lean Dem, Identify with a religion | Lower bound of confidence interval, Rep/lean Rep, Attend religious services at least monthly | Upper bound of confidence interval, Rep/lean Rep, attend religious services at least monthly | Lower bound of confidence interval, Dem/lean Dem, Attend religious services at least monthly | Upper bound of confidence interval, Dem/lean Dem, Attend religious services at least monthly | Lower bound of confidence interval, Rep/lean Rep, Pray daily | Upper bound of confidence interval, Rep/lean Rep, Pray daily | Lower bound of confidence interval, Dem/lean Dem, Pray daily | Upper bound of confidence interval, Dem/lean Dem, Pray daily | Lower bound of confidence interval, Rep/lean Rep, View religion as very important | Upper bound of confidence interval, Rep/lean Rep, View religion as very important | Lower bound of confidence interval, Dem/lean Dem, View religion as very important | Upper bound of confidence interval, Dem/lean Dem, View religion as very important | Lower bound of confidence interval, Rep/lean Rep, Identify with a religion | Upper bound of confidence interval, Rep/lean Rep, Identify with a religion | Lower bound of confidence interval, Dem/lean Dem, Identify with a religion | Upper bound of confidence interval, Dem/lean Dem, Identify with a religion | |
|---|---|---|---|---|---|---|---|---|---|---|---|---|---|---|---|---|---|---|---|---|---|---|---|---|
| All U.S. adults | 40 | 26 | 53 | 38 | 52 | 34 | 79 | 61 | 38.0 | 41.2 | 24.5 | 27.1 | 51.2 | 54.4 | 36.4 | 39.4 | 50.1 | 53.3 | 32.0 | 35.0 | 77.5 | 80.1 | 59.1 | 62.1 |
| Among people who were born … | ||||||||||||||||||||||||
| 2004-08 (now roughly ages 18-22) | 55 | 31 | 53 | 22 | 51 | 23 | 71 | 50 | 44.9 | 64.7 | 24.4 | 38.2 | 42.6 | 62.4 | 15.8 | 28.0 | 40.6 | 60.4 | 16.6 | 29.0 | 62.0 | 80.0 | 42.6 | 57.4 |
| 2000-03 (ages 23-26) | 36 | 20 | 36 | 18 | 37 | 19 | 64 | 38 | 27.7 | 44.7 | 13.8 | 25.2 | 27.4 | 44.4 | 12.9 | 23.9 | 28.6 | 45.8 | 13.0 | 24.2 | 55.2 | 72.2 | 31.1 | 44.9 |
| In the 1990s (ages 27-36) | 36 | 18 | 45 | 27 | 48 | 25 | 70 | 49 | 31.6 | 40.4 | 15.0 | 21.0 | 40.1 | 49.1 | 23.2 | 30.0 | 43.1 | 52.1 | 21.3 | 27.9 | 66.2 | 74.6 | 44.7 | 52.3 |
| In the 1980s (ages 37-46) | 36 | 22 | 46 | 33 | 45 | 31 | 71 | 53 | 31.6 | 39.4 | 18.6 | 24.8 | 42.1 | 50.3 | 29.4 | 36.4 | 40.5 | 48.5 | 27.2 | 34.0 | 67.0 | 74.4 | 49.0 | 56.4 |
| In the 1970s (ages 47-56) | 39 | 23 | 53 | 44 | 51 | 37 | 81 | 68 | 35.5 | 43.1 | 20.1 | 26.9 | 48.8 | 56.4 | 39.6 | 47.6 | 46.8 | 54.4 | 32.7 | 40.5 | 77.6 | 83.6 | 64.1 | 71.7 |
| In the 1960s (ages 57-66) | 37 | 29 | 58 | 51 | 53 | 42 | 85 | 71 | 33.6 | 40.0 | 26.0 | 32.8 | 54.6 | 61.2 | 47.1 | 54.5 | 50.0 | 56.6 | 38.1 | 45.3 | 83.1 | 87.7 | 67.3 | 74.1 |
| In the 1950s (ages 67-76) | 44 | 34 | 63 | 52 | 62 | 44 | 88 | 76 | 40.8 | 47.4 | 30.5 | 36.7 | 59.8 | 66.2 | 48.6 | 55.2 | 59.2 | 65.6 | 41.1 | 47.7 | 85.5 | 89.9 | 72.6 | 78.4 |
| Before 1950 (roughly ages 77+) | 47 | 37 | 64 | 50 | 63 | 44 | 91 | 79 | 42.9 | 50.7 | 33.3 | 40.9 | 59.7 | 67.3 | 46.1 | 53.9 | 58.9 | 66.5 | 40.4 | 48.2 | 88.9 | 93.3 | 75.9 | 82.3 |
“Religion Remains Stable in the U.S., With Mixed Signals for Young Adults”
More broadly, the surveys find no evidence that today’s youngest adults are any more likely than older people to be Republicans or to lean toward the GOP. In our 2025-26 surveys, the percentage of the youngest adults (born between 2004 and 2008, now roughly ages 18 to 22) who say they identify with or lean toward the Republican Party is 34%, which is roughly on par with people born in the early 2000s (39%) and significantly lower than in every older age group. In this youngest group, 56% identify as or lean Democratic, while 10% do not identify with or lean toward either party.
What surveys by other organizations show about religion among young Americans
Findings from other high-quality surveys show some similarities with recent Pew Research Center results in terms of the religious characteristics of young adults. But there are also some key differences, which add to the difficulty in interpreting the signals in the data.
Gallup
Recent Gallup polls show an increase in the percentage of 18- to 29-year-old men who say religion is very important in their lives and that they attend religious services regularly.
The Gallup surveys also find that there are now more young men than young women who say religion is very important to them, and that equal shares of young men and women say they attend religious services at least monthly.
By contrast, an aggregation of Pew Research Center surveys from 2025 and 2026 finds that among people ages 18 to 29, more young men than women attend services regularly, while roughly equal shares of young men and women say religion is very important to them.
American Time Use Survey
We also examined the American Time Use Survey (ATUS). The ATUS is sponsored by the Bureau of Labor Statistics and conducted by the U.S. Census Bureau. It is a “diary study,” meaning that it asks respondents to describe how they spent their time during the previous day as if they were chronicling it in a diary.
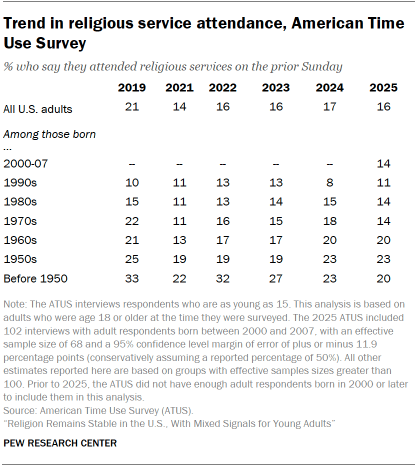
In our analysis of the ATUS, we focus mainly on data from 2021 through 2025, to match the rest of the analysis in this report. We exclude 2020 since many churches were closed or open only on a limited basis during a portion of that year because of the COVID-19 pandemic. ATUS data collection was also significantly impacted by the pandemic in 2020, leading to estimates that are not representative of the full year. We include data from 2019 as a pre-pandemic reference point.
There are not enough adult respondents in the ATUS born in 2000 or later for us to be able to track their religious attendance over time. Similarly, there are too few people born after 2000 in the 2025 ATUS for us to subdivide them into older and younger subcategories (e.g., those born between 2000 and 2003 vs. those born in 2004 or later) the way we do with Pew Research Center data.
But the 2025 ATUS does include enough interviews with respondents born in 2000 or later to compare them with older adults.14 The 2025 ATUS finds that 14% of young adults born in 2000 or later say they attended religious services on the prior Sunday.15 That’s about the same as among people in older age groups; none of the differences between people born in 2000 or later and those born in prior decades are statistically significant, once margins of error are taken into account.
Among respondents born in the 1970s and those born before 1950, the 2025 ATUS finds that religious attendance is somewhat lower now than in 2019, just before the pandemic. In the other birth cohorts that can be tracked over time, the 2025 ATUS finds that religious attendance is about the same now as in 2019.
Tracking changes in how people participated in religious services during the COVID-19 pandemic
In July 2020, about four months after the onset of the COVID-19 pandemic, Pew Research Center asked two new survey questions.
In the last month, did you attend religious services in person at a church, synagogue, mosque, or other house of worship?
And
In the last month, have you watched religious services online or on TV?
Respondents could answer “yes” to one question, both questions or neither.
At the time of the July 2020 survey, many religious congregations were open only on a limited basis or were closed altogether because of the pandemic. We found that the number of people who had recently watched religious services online or on TV (36%) was far larger than the share who had recently attended services in person (13%).
Since then, the Center has repeated these questions on six surveys over the past six years. The surveys show that as the public health situation improved and congregations reopened their doors, the percentage of people saying they had attended services in person during the prior month has risen over time. In our most recent reading, from June 2026, it stands at 34%.
By contrast, the percentage of people who say they have recently watched religious services online or on TV is lower now (26%) than it was in the early days of the pandemic.
This basic pattern is echoed across birth cohorts. The percentage of people who say they have recently attended religious services in person is higher now than in 2020 within every birth cohort that can be tracked back that far, from the oldest to the youngest. And the percentage of people who say they have recently watched services online or on TV is lower now than in 2020 within every birth cohort.
Unfortunately, since the Center did not ask these questions before the COVID-19 pandemic, we do not know whether the percentage of Americans who have recently attended religious services in person has now reached pre-pandemic levels, exceeded these levels, or still has room to go before reaching the pre-pandemic level. Before the pandemic, we asked people how often, in general, they attended religious services. We did not ask specifically about attendance in the prior month, nor did we ask separately about attending in person versus watching online or on TV.