
Pew Research Center conducted this study to understand how Americans voted in 2024 and how their turnout and vote choices differed from 2016 and 2020.
For this analysis, we surveyed 8,942 U.S. citizens ages 18 and older who are members of the Center’s American Trends Panel (ATP). We verified their turnout in the five general elections from 2016 to 2024 using commercial voter files that collect publicly available official state turnout records.
After each general election, panelists were asked if they voted and for whom (presidential candidates in 2016, 2020, and 2024 and U.S. House candidates in 2018 and 2022). For elections that had occurred before an individual joined the panel, turnout and vote choice were measured soon after their recruitment. For all elections, panelists who said in a postelection survey that they had voted and for whom a record of voting was located are considered validated voters; all others are presumed not to have voted.
The 2024 election and comparisons with earlier elections
Much of this report describes the 2024 vote broken down by various groups in the population, taken from the 2024 postelection survey (described below), with similar reporting from postelection surveys conducted after the 2016 presidential, 2018 congressional, 2020 presidential, and 2022 congressional elections. Estimates for all earlier elections except 2020 are identical to those published in Pew Research Center’s earlier reports and rely solely on the relevant postelection surveys at the time. Results from 2020 reported here and in the online detailed tables may be slightly different from those in the 2020 version of the report because we revised our statistical approach for the 2020 survey when we published the 2022 postelection report. More detail about the revision of the 2020 estimates can be found at the end of this Methodology chapter.
The postelection ATP surveys used in this report were conducted Nov. 29-Dec. 12, 2016; Nov. 7-16, 2018; Nov. 12-17, 2020; Nov. 16-27, 2022; and Nov. 12-17, 2024. The surveys are weighted to be representative of the U.S. adult population by gender, age, race, ethnicity, partisan affiliation, education, and many other characteristics, as described below.
Validating turnout
In order to verify panelists’ self-reported turnout in the 2024 election, an effort was made to match the panelists to lists of registered voters (sometimes referred to as “voter files”) from three vendors. One vendor works mostly with conservative and Republican organizations and campaigns; one works mostly with progressive and Democratic organizations and campaigns; and one is nonpartisan. These lists are updated following each election with a record of everyone who is registered to vote and turnout for all individuals who voted in the election.
For purposes of this study, a panelist is considered a validated voter if they said they voted in the election and a turnout record for them was located in at least one of the three voter lists. People who said they did not vote, along with those who said they voted but for whom no record of turnout could be located in any of the three lists, were considered nonvoters. Nonvoters include individuals whose names were not found in any of the files. Panelists who did not provide us with their names are excluded from this analysis entirely. In addition, panelists who did not answer voter turnout or vote choice questions in 2020, 2022 or 2024 are excluded from this analysis.
Because of a law passed in 2018, Utah residents can opt to keep their voter registration and vote history data private. Consequently, panelists who live in Utah are considered to be voters if they reported having voted when asked in the postelection survey, without any voter file validation.
Out of the 8,942 voting-age citizens, 8,410 (94%) were matched to at least one of these files; 7,100 are considered to be validated voters. Panelists who said they did not vote and those who provided names but could not be matched, or for whom no 2024 turnout record could be located, were considered to be validated nonvoters (1,842 panelists).
The American Trends Panel survey methodology
The American Trends Panel, created by Pew Research Center, is a nationally representative panel of randomly selected U.S. adults. Currently, panelists participate via self-administered web surveys or live telephone interviews. Interviews are conducted in both English and Spanish. The panel is being managed by SSRS.
At the time of the Nov. 29-Dec. 12, 2016, survey, the panel was managed by Abt Associates. At the time of data collection for the 2018, 2020 and 2022 surveys, it was managed by Ipsos.
Methodology reports for the surveys from 2016-2022 can be found in each year’s validated voter report: 2016, 2018, 2020, 2022.
To learn more about the ATP, read “What is the American Trends Panel?”
Detailed ATP methodology for 2024
The survey for Wave 159 of the ATP was conducted from Nov. 12 to Nov. 17, 2024. A total of 9,609 panelists responded out of 10,604 who were sampled, for a survey-level response rate of 91%.
The cumulative response rate accounting for nonresponse to the recruitment surveys and attrition is 3%. The break-off rate among panelists who logged on to the survey and completed at least one item is less than 1%.
SSRS conducted the survey for Pew Research Center via online (n=9,323) and live telephone (n=286) interviewing. Interviews were conducted in both English and Spanish.
Panel recruitment
Since 2018, the ATP has used address-based sampling (ABS) for recruitment. A study cover letter and a pre-incentive are mailed to a stratified, random sample of households selected from the U.S. Postal Service’s Computerized Delivery Sequence File. This Postal Service file has been estimated to cover 90% to 98% of the population.1 Within each sampled household, the adult with the next birthday is selected to participate. Other details of the ABS recruitment protocol have changed over time but are available upon request.2 Prior to 2018, the ATP was recruited using landline and cellphone random-digit-dial surveys administered in English and Spanish.
A national sample of U.S. adults has been recruited to the ATP approximately once per year since 2014. In some years, the recruitment has included additional efforts (known as an “oversample”) to improve the accuracy of data for underrepresented groups. For example, Hispanic adults, Black adults and Asian adults were oversampled in 2019, 2022 and 2023, respectively.
Sample design
The overall target population for this survey was noninstitutionalized persons ages 18 and older living in the United States. All active panel members were invited to participate in this wave.
Questionnaire development and testing
The questionnaire was developed by Pew Research Center in consultation with SSRS. The web program used for online respondents was rigorously tested on both PC and mobile devices by the SSRS project team and Pew Research Center researchers. The SSRS project team also populated test data that was analyzed in SPSS to ensure the logic and randomizations were working as intended before launching the survey.
Incentives
All respondents were offered a post-paid incentive for their participation. Respondents could choose to receive the post-paid incentive in the form of a check or gift code to Amazon.com, Target.com or Walmart.com. Incentive amounts ranged from $5 to $20 depending on whether the respondent belongs to a part of the population that is harder or easier to reach. Differential incentive amounts were designed to increase panel survey participation among groups that traditionally have low survey response propensities.
Data collection protocol
The data collection field period for this survey was Nov. 12 to Nov. 17, 2024. Surveys were conducted via self-administered web survey or by live telephone interviewing.
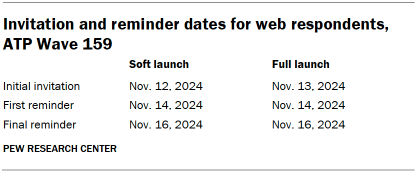
For panelists who take surveys online:3 Postcard notifications were mailed to a subset on Nov. 12.4 Survey invitations were sent out in two separate launches: soft launch and full launch. Sixty panelists were included in the soft launch, which began with an initial invitation sent on Nov. 12. All remaining English- and Spanish-speaking sampled online panelists were included in the full launch and were sent an invitation on Nov. 13.
Panelists participating online were sent an email invitation and up to two email reminders if they did not respond to the survey. ATP panelists who consented to SMS messages were sent an SMS invitation with a link to the survey and up to two SMS reminders.
For panelists who take surveys over the phone with a live interviewer: Prenotification postcards were mailed on Nov. 8. Soft launch took place on Nov. 12 and involved dialing until a total of eight interviews had been completed. All remaining English- and Spanish-speaking sampled phone panelists’ numbers were dialed throughout the remaining field period. Panelists who take surveys via phone can receive up to six calls from trained SSRS interviewers.
Data quality checks
To ensure high-quality data, Center researchers performed data quality checks to identify any respondents showing patterns of satisficing. This includes checking for whether respondents left questions blank at very high rates or always selected the first or last answer presented. As a result of this checking, three ATP respondents were removed from the survey dataset prior to weighting and analysis.
Weighting of the 2024 study
Because some people are more likely than others to participate in surveys, survey data must be weighted for it to be fully representative of the population. This means giving more or less weight to different kinds of people based on how we sampled them and based on comparing how many of them are in the population versus how many are in our survey data. For this study, weighting involved a large number of considerations, as described below.
The weighting for this study is different from a standard wave of the ATP. It is designed to provide accurate estimates of 2024 voter choice and candidate preference among nonvoters as well as voters, and to make comparisons involving data collected about the 2020 and 2022 elections.
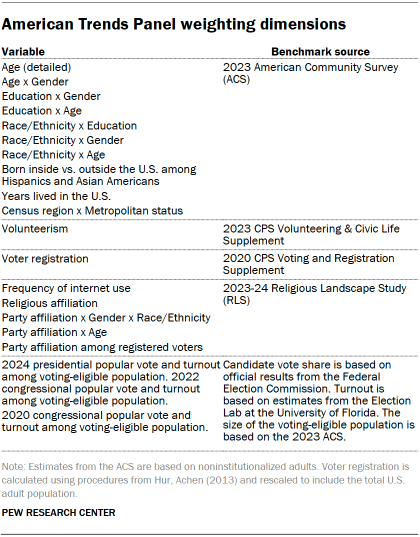
The ATP data is weighted in a process that accounts for multiple stages of sampling and nonresponse that occur at different points in the panel survey process. First, each panelist begins with a base weight that reflects their probability of recruitment into the panel. These weights are then calibrated to align with the population benchmarks in the accompanying table to correct for nonresponse to recruitment surveys and panel attrition. If only a subsample of panelists was invited to participate in the wave, this weight is adjusted to account for any differential probabilities of selection.
Among the panelists who completed the survey, this weight is then calibrated again to align with the population benchmarks identified in the accompanying table. The weights were then trimmed at the 1st and 99th percentiles to reduce the loss in precision stemming from variance in the weights. In a final step, the trimmed weights were recalibrated to align exactly with the benchmarks for voter turnout and the presidential popular vote. Sampling errors and tests of statistical significance take into account the effect of weighting.
The following table shows the unweighted sample sizes and the error attributable to sampling that would be expected at the 95% level of confidence for different groups in the survey.
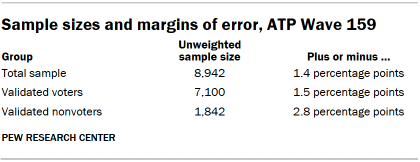
Sample sizes and sampling errors for other subgroups are available upon request. In addition to sampling error, one should bear in mind that question wording and practical difficulties in conducting surveys can introduce error or bias into the findings of opinion polls.
Vote choice measures for panelists who did not participate in one or more of the surveys conducted in 2016, 2018, 2020 or 2022
A large number of people who participated in the 2024 postelection survey had not been on the panel or did not respond to the 2016, 2018, 2020 or 2022 postelection surveys at the time they were conducted. For these panelists, their vote choices for 2016, 2018, 2020 or 2022 were measured after the fact. Details about this measurement for 2016-2022 can be found in the methodology statement of the 2022 voter report. Panelists recruited in 2023 and 2024 were asked about their 2020 and 2022 votes during their recruitment or profile survey.
More details about the revision of the 2020 data
As part of the report on the 2022 midterm elections, we revised our statistical approach for the 2020 survey. That produced new results that slightly changed the numbers we had previously reported about the 2020 election but changed no substantive findings in our report. There was nothing inaccurate about the 2020 results, but we chose to use a slightly different survey weighting approach that increases the precision of our estimates for some of the groups of voters we discussed in the report, especially those that are difficult to reach and interview.
Although the revised numbers for 2020 appear in the current report and in the accompanying online data tables, the report on the 2020 election has not been changed, and the data tables provided with that report are still available.
How family income tiers are calculated
To classify panelists as upper, middle, or lower income in this study, family income data is adjusted for household size and cost-of-living differences by geography. Panelists then are assigned to income tiers that are based on the median adjusted family income of all American Trends Panel members. The process uses the following steps:
- First, panelists are assigned to the midpoint of the income range they selected in a family income question that was measured on either the most recent annual profile survey or, for newly recruited panelists, their recruitment survey. This provides an approximate income value that can be used in calculations for the adjustment.
- Next, these income values are adjusted for the cost of living in the geographic area where the panelist lives. This is calculated using price indexes published by the U.S. Bureau of Economic Analysis. These indexes, known as Regional Price Parities (RPP), compare the prices of goods and services across all U.S. metropolitan statistical areas as well as non-metro areas with the national average prices for the same goods and services. The most recent available data at the time of the annual profile survey is from 2022. Those who fall outside of metropolitan statistical areas are assigned the overall RPP for their state’s non-metropolitan area.
- Family incomes are further adjusted for the number of people in a household using the methodology from Pew Research Center’s previous work on the American middle class. This is done because a four-person household with an income of say, $50,000, faces a tighter budget constraint than a two-person household with the same income.
- Panelists are then assigned an income tier. “Middle-income” adults are in families with adjusted family incomes that are between two-thirds and double the median adjusted family income for the full ATP at the time of the most recent annual profile survey. The median adjusted family income for the panel is roughly $74,100. Using this median income, the middle-income range is about $49,400 to $148,200. Lower-income families have adjusted incomes less than $49,400 and upper-income families have adjusted incomes greater than $148,200 (all figures expressed in 2023 dollars and scaled to a household size of three). If a panelist did not provide their income and/or their household size, they are assigned “no answer” in the income tier variable.
Two examples of how a given area’s cost-of-living adjustment was calculated are as follows: the Pine Bluff metropolitan area in Arkansas is a relatively inexpensive area, with a price level that is 19.1% less than the national average. The San Francisco-Oakland-Berkeley metropolitan area in California is one of the most expensive areas, with a price level that is 17.9% higher than the national average. Income in the sample is adjusted to make up for this difference. As a result, a family with an income of $40,400 in the Pine Bluff area is as well off financially as a family of the same size with an income of $58,900 in San Francisco.


