The American Trends Panel survey methodology
Overview
The American Trends Panel (ATP), created by Pew Research Center, is a nationally representative panel of randomly selected U.S. adults. Panelists participate via self-administered web surveys. Panelists who do not have internet access at home are provided with a tablet and wireless internet connection. Interviews are conducted in both English and Spanish. The panel is being managed by Ipsos.
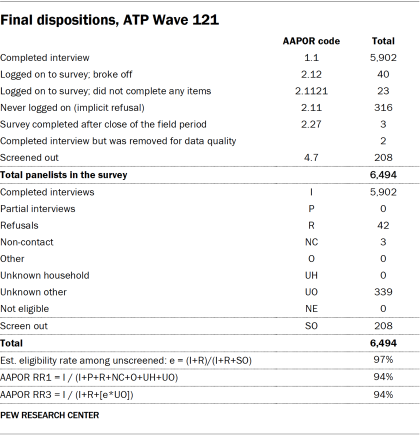
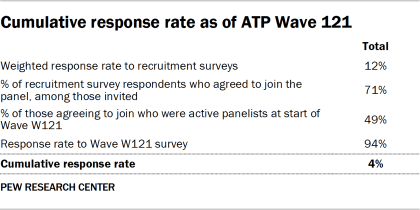
Data in this report is drawn from the panel wave conducted from Feb. 6 to Feb. 12, 2023, among a sample of ATP members who indicated that they currently work either full or part time for pay. A total of 5,902 panelists responded out of 6,494 who were sampled, for a response rate of 94% (AAPOR RR3). The cumulative response rate accounting for nonresponse to the recruitment surveys and attrition is 4%. The break-off rate among panelists who logged on to the survey and completed at least one item is 1%. The margin of sampling error for the full sample of 5,902 respondents is plus or minus 1.9 percentage points.
Panel recruitment
The ATP was created in 2014, with the first cohort of panelists invited to join the panel at the end of a large, national, landline and cellphone random-digit-dial survey that was conducted in both English and Spanish. Two additional recruitments were conducted using the same method in 2015 and 2017, respectively. Across these three surveys, a total of 19,718 adults were invited to join the ATP, of whom 9,942 (50%) agreed to participate.
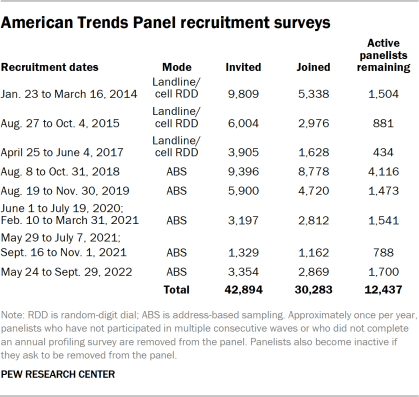
In August 2018, the ATP switched from telephone to address-based recruitment. Invitations were sent to a stratified, random sample of households selected from the U.S. Postal Service’s Delivery Sequence File. Sampled households receive mailings asking a randomly selected adult to complete a survey online. A question at the end of the survey asks if the respondent is willing to join the ATP. In 2020 and 2021 another stage was added to the recruitment. Households that did not respond to the online survey were sent a paper version of the questionnaire, $5 and a postage-paid return envelope. A subset of the adults who returned the paper version of the survey were invited to join the ATP. This subset of adults received a follow-up mailing with a $10 pre-incentive and invitation to join the ATP.
Across the five address-based recruitments, a total of 23,176 adults were invited to join the ATP, of whom 20,341 agreed to join the panel and completed an initial profile survey. In each household, one adult was selected and asked to go online to complete a survey, at the end of which they were invited to join the panel. Of the 30,283 individuals who have ever joined the ATP, 12,437 remained active panelists and continued to receive survey invitations at the time this survey was conducted.
The U.S. Postal Service’s Delivery Sequence File has been estimated to cover as much as 98% of the population, although some studies suggest that the coverage could be in the low 90% range.3 The American Trends Panel never uses breakout routers or chains that direct respondents to additional surveys.
Sample design
The overall target population for this survey was non-institutionalized persons ages 18 and older living in the U.S., including Alaska and Hawaii, who work for pay either full time or part time. All active panel members who reported working either full or part time for pay in ATP Wave 119 (fielded in December 2022), were invited to participate in this wave. Respondents were again asked about their current employment situation at the beginning of this survey, and those who indicated that they were not currently working for pay were screened out.
Questionnaire development and testing
The questionnaire was developed by Pew Research Center in consultation with Ipsos. The web program was rigorously tested on both PC and mobile devices by the Ipsos project management team and Pew Research Center researchers. The Ipsos project management team also populated test data that was analyzed in SPSS to ensure the logic and randomizations were working as intended before launching the survey.
Incentives
All respondents were offered a post-paid incentive for their participation. Respondents could choose to receive the post-paid incentive in the form of a check or a gift code to Amazon.com or could choose to decline the incentive. Incentive amounts ranged from $5 to $20 depending on whether the respondent belongs to a part of the population that is harder or easier to reach. Differential incentive amounts were designed to increase panel survey participation among groups that traditionally have low survey response propensities.
Data collection protocol
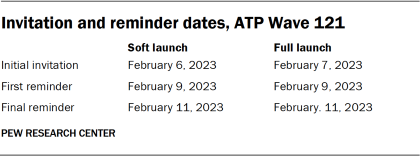
The data collection field period for this survey was Feb. 6-12, 2023. Postcard notifications were mailed to all ATP panelists with a known residential address on Feb. 6.
Invitations were sent out in two separate launches: soft launch and full launch. Sixty panelists were included in the soft launch, which began with an initial invitation sent on Feb. 6. The ATP panelists chosen for the initial soft launch were known responders who had completed previous ATP surveys within one day of receiving their invitation. All remaining English- and Spanish-speaking panelists were included in the full launch and were sent an invitation on Feb. 7.
All panelists with an email address received an email invitation and up to two email reminders if they did not respond to the survey. All ATP panelists who consented to SMS messages received an SMS invitation and up to two SMS reminders.
Data quality checks
To ensure high-quality data, the Center’s researchers performed data quality checks to identify any respondents showing clear patterns of satisficing. This includes checking for very high rates of leaving questions blank, as well as always selecting the first or last answer presented. As a result of this checking, two ATP respondents were removed from the survey dataset prior to weighting and analysis.
Weighting
The ATP data is weighted in a multistep process that accounts for multiple stages of sampling and nonresponse that occur at different points in the survey process. For this wave, each respondent was initially given the value of their final weight from Wave 119. This was done because the sample was comprised exclusively of W119 respondents who reported working full or part time for pay in that wave, and accounts for their probability of selection for both their initial ATP recruitment survey and Wave 119 as well as the adjustments for any nonresponse and attrition that occurred prior to the completion of Wave 19. For details on Wave 119’s weighting, see the W119 survey methodology.
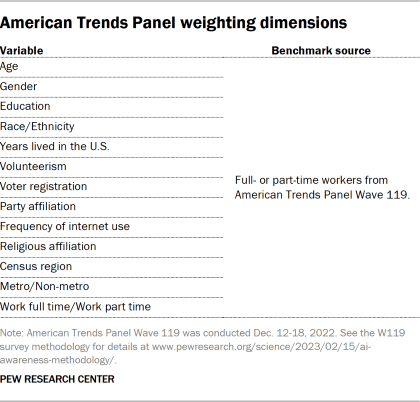
To adjust for nonresponse to the current wave, this weight was further calibrated to align with a set of weighting parameters calculated among all Wave 119 respondents who reported working either full or part time for pay. The specific weighting dimensions are listed in the accompanying table. In a final step, these weights were trimmed at the 1st and 99th percentiles to reduce the loss in precision stemming from variance in the weights. Sampling errors and tests of statistical significance take into account the effect of weighting.
The following table shows the unweighted sample sizes and the error attributable to sampling that would be expected at the 95% level of confidence for different groups in the survey.
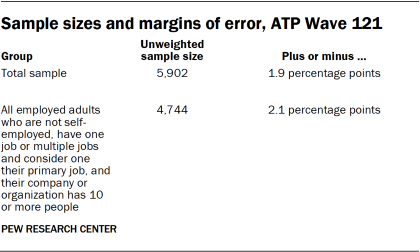
Sample sizes and sampling errors for other subgroups are available upon request. In addition to sampling error, one should bear in mind that question wording and practical difficulties in conducting surveys can introduce error or bias into the findings of opinion polls.
Dispositions and response rates
A note about the Asian adult sample
This survey includes a total sample size of 259 Asian workers. The sample primarily includes English-speaking Asian adults and, therefore, may not be representative of the overall Asian adult population. Despite this limitation, it is important to report the views of Asian adults on the topics in this study. As always, Asian adults’ responses are incorporated into the general population figures throughout this report. Because of the relatively small sample size and a reduction in precision due to weighting, we are not able to analyze Asian adults separately when looking at specific categories, such as gender.