The American Trends Panel survey methodology
Overview
The American Trends Panel (ATP), created by Pew Research Center, is a nationally representative panel of randomly selected U.S. adults. Panelists participate via self-administered web surveys. Panelists who do not have internet access at home are provided with a tablet and wireless internet connection. Interviews are conducted in both English and Spanish. The panel is being managed by Ipsos.
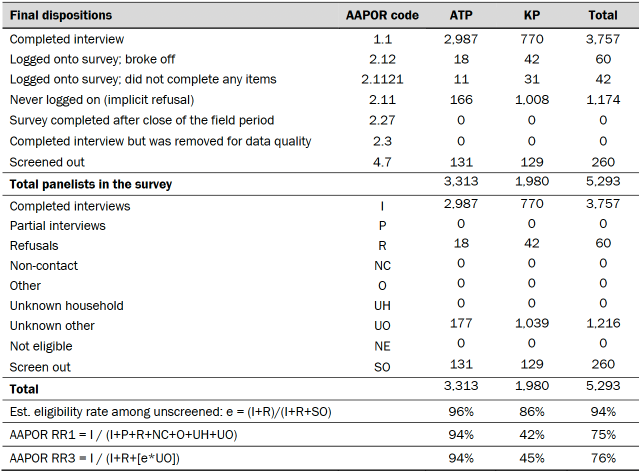
Data in this report is drawn from the panel wave conducted from Sept. 20 to Oct. 2, 2022, among a sample of U.S. adults who are parents of at least one child under the age of 18. A total of 3,757 panelists responded out of 5,293 who were sampled, for a response rate of 76% (AAPOR RR3). This included 2,987 respondents from the ATP and an oversample of 770 Hispanic, non-Hispanic Black and non-Hispanic Asian respondents from Ipsos’ KnowledgePanel in order to provide more precise estimates of the opinions and experiences of these smaller demographic subgroups. These oversampled groups are weighted back to reflect their correct proportions in the population.
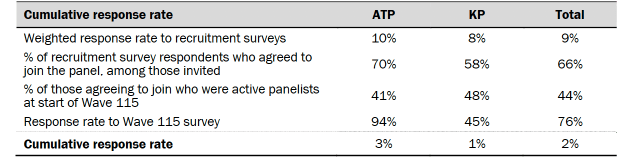
The cumulative response rate accounting for nonresponse to the recruitment surveys and attrition is 2%. The break-off rate among panelists who logged on to the survey and completed at least one item is 2%. The margin of sampling error for the full sample of 3,757 respondents is plus or minus 2.2 percentage points.
Panel recruitment
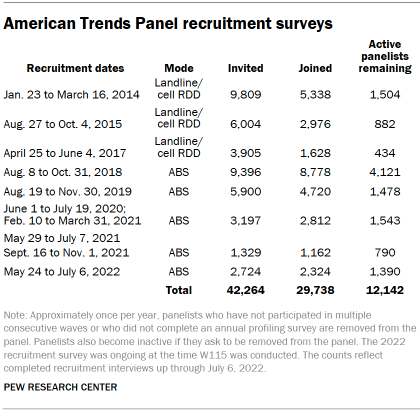
The ATP was created in 2014, with the first cohort of panelists invited to join the panel at the end of a large, national, landline and cellphone random-digit-dial survey that was conducted in both English and Spanish. Two additional recruitments were conducted using the same method in 2015 and 2017, respectively. Across these three surveys, a total of 19,718 adults were invited to join the ATP, of whom 9,942 (50%) agreed to participate.
In August 2018, the ATP switched from telephone to address-based recruitment. Invitations were sent to a stratified, random sample of households selected from the U.S. Postal Service’s Delivery Sequence File. Sampled households receive mailings asking a randomly selected adult to complete a survey online. A question at the end of the survey asks if the respondent is willing to join the ATP. In 2020 and 2021 another stage was added to the recruitment. Households that did not respond to the online survey were sent a paper version of the questionnaire, $5 and a postage-paid return envelope. A subset of the adults who returned the paper version of the survey were invited to join the ATP. This subset of adults received a follow-up mailing with a $10 pre-incentive and invitation to join the ATP.
Across the five address-based recruitments, a total of 22,546 adults were invited to join the ATP, of whom 19,796 agreed to join the panel and completed an initial profile survey. In each household, one adult was selected and asked to go online to complete a survey, at the end of which they were invited to join the panel. Of the 29,738 individuals who have ever joined the ATP, 12,142 remained active panelists and continued to receive survey invitations at the time this survey was conducted.
The U.S. Postal Service’s Delivery Sequence File has been estimated to cover as much as 98% of the population, although some studies suggest that the coverage could be in the low 90% range.4 The American Trends Panel never uses breakout routers or chains that direct respondents to additional surveys.
Sample design
The overall target population for this survey was non-institutionalized persons ages 18 and older living in the U.S., including Alaska and Hawaii, who are parents of at least one child under the age of 18. The ATP sample consisted of all current panel members who reported having at least one child under the age of 18 on the ATP’s 2022 annual profile survey. The ATP was supplemented with an oversample of Hispanic, non-Hispanic Black and non-Hispanic Asian respondents from the KnowledgePanel who are parents of at least one child under the age of 18.
Questionnaire development and testing
The questionnaire was developed by Pew Research Center in consultation with Ipsos. The web program was rigorously tested on both PC and mobile devices by the Ipsos project management team and Pew Research Center researchers. The Ipsos project management team also populated test data that was analyzed in SPSS to ensure the logic and randomizations were working as intended before launching the survey.
Incentives
All ATP respondents were offered a post-paid incentive for their participation. Respondents could choose to receive the post-paid incentive in the form of a check or a gift code to Amazon.com or could choose to decline the incentive. Incentive amounts ranged from $5 to $20 depending on whether the respondent belongs to a part of the population that is harder or easier to reach. Differential incentive amounts were designed to increase panel survey participation among groups that traditionally have low survey response propensities.
Ipsos operates an ongoing modest incentive program for KnowledgePanel to encourage participation and create member loyalty. The incentive program includes special raffles and sweepstakes with both cash rewards and other prizes to be won. Typically, panel members are assigned no more than one survey per week. On average, panel members complete two to three surveys per month with durations of 10 to 15 minutes per survey. An additional incentive is usually provided for longer surveys. For this survey, during the last few days of data collection, KnowledgePanel members who self-identified as Asian or Asian American were offered 10,000 points (equivalent to $10) in addition to the regular incentive program in an attempt to boost the number of responses from panel members who identified as Asian or Asian American.
Data collection protocol
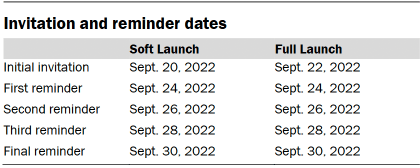
The data collection field period for this survey was Sept. 20 to Oct. 2, 2022. Postcard notifications were mailed to all ATP panelists with a known residential address on Sept. 19.
Invitations were sent out in two separate launches: Soft Launch and Full Launch. Sixty ATP panelists and 609 KnowledgePanel panelists were included in the soft launch, which began with an initial invitation sent on Sept. 20. The ATP panelists chosen for the initial soft launch were known responders who had completed previous ATP surveys within one day of receiving their invitation. All remaining English- and Spanish-speaking panelists were included in the full launch and were sent an invitation on Sept. 22.
All panelists with an email address received an email invitation and up to four email reminders if they did not respond to the survey. All ATP panelists who consented to SMS messages received an SMS invitation and up to four SMS reminders.
Data quality checks
To ensure high-quality data, the Center’s researchers performed data quality checks to identify any respondents showing clear patterns of satisficing. This includes checking for very high rates of leaving questions blank, as well as always selecting the first or last answer presented. After this checking, no respondents were removed from the survey dataset prior to weighting and analysis.
Weighting
The data is weighted in a multistep process that accounts for multiple stages of sampling and nonresponse that occur at different points in the survey process. First, each panelist begins with a base weight that reflects their probability of selection for their initial recruitment survey. These weights are then rescaled and adjusted to account for changes in the design of recruitment surveys from year to year, nonresponse to the recruitment survey and panel attrition. Weights for the KnowledgePanel respondents were also adjusted to account for their probability of being selected to participate in this survey. No such adjustment was made for ATP respondents because all eligible ATP members were invited to participate.
Next, respondents were placed into one of four sample groups: 1) non-Hispanic Black respondents, 2) non-Hispanic Asian respondents, 3) Hispanic respondents and 4) all other respondents. Separately within each group, the weights for ATP and KnowledgePanel respondents were scaled to be proportional to their effective sample size within that group. The ATP and KnowledgePanel respondents were then recombined and the weights were poststratified so that the weighted proportion of respondents in each of the four groups matched its share of all U.S. adults who are parents of at least one child under 18.
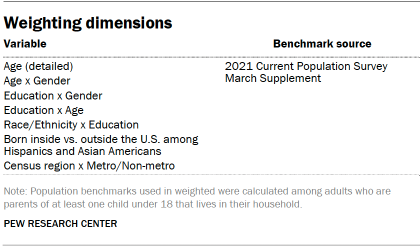
The weights were then calibrated to align with the population benchmarks in the accompanying table which were calculated for the population of U.S. adults who are parents of at least one child under 18 that lives in their household. Finally, the weights were trimmed at the 1st and 99th percentiles to reduce the loss in precision stemming from variance in the weights.
For part of this survey, parents were asked a series of questions about either their oldest or youngest child in grades K-12 at random. Additional sets of weights were created for parents who were asked about a child in elementary school, middle school or high school respectively to account for the possibility that for some parents, it would have been possible for a child in a different grade level to have been randomly selected. These were created by adjusting each parent’s full-sample weight based on the proportion of their children in the same grade level as the selected child.
The following table shows the unweighted sample sizes and the error attributable to sampling that would be expected at the 95% level of confidence for different groups in the survey.
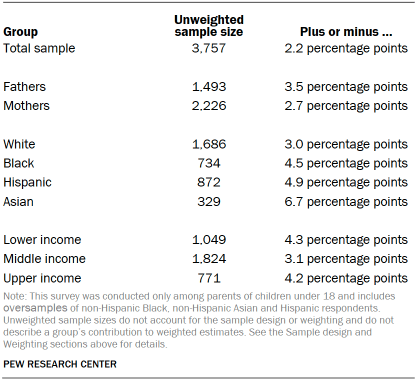
Sample sizes and sampling errors for other subgroups are available upon request. In addition to sampling error, one should bear in mind that question wording and practical difficulties in conducting surveys can introduce error or bias into the findings of opinion polls.
Dispositions and response rates
Adjusting income and defining income tiers
To create upper-, middle- and lower-income tiers, respondents’ 2021 family incomes were adjusted for differences in purchasing power by geographic region and household size. “Middle-income” adults live in families with annual incomes that are two-thirds to double the median family income in the panel (after incomes have been adjusted for the local cost of living and household size). The middle-income range for the American Trends Panel is about $43,800 to $131,500 annually for an average family of three. Lower-income families have incomes less than roughly $43,800, and upper-income families have incomes greater than roughly $131,500 (all figures expressed in 2021 dollars).
Based on these adjustments, 29% of respondents in Wave 115 are lower income, 50% are middle income and 18% fall into the upper-income tier. An additional 3% either didn’t offer a response to the income question or the household size question.
More information about how the income tiers were determined can be found here.
A note about the Asian adult sample
This survey includes a total sample size of 329 Asian parents. The sample primarily includes English-speaking Asian adults and, therefore, may not be representative of the overall Asian adult population. Despite this limitation, it is important to report the views of Asian adults on the topics in this study. As always, Asian adults’ responses are incorporated into the general population figures throughout this report.
© Pew Research Center, 2023