
Survey of Income and Program Participation
The figures on the wealth of households are derived from the U.S. Census Bureau’s Survey of Income and Program Participation (SIPP). SIPP is one of the few nationally representative data sources on the assets and liabilities of households. SIPP has periodically asked a detailed set of questions on assets and liabilities, and SIPP is the basis for the Census Bureau’s P-70 series of reports on household wealth. The 1984 figures come directly from the Census Bureau’s 1986 P-70 report Household Wealth and Asset Ownership: 1984: Data from the Survey of Income and Program Participation.
SIPP is nationally representative of the civilian non-institutionalized population in the United States. The 1984 figures exclude persons in group quarters and, for the sake of comparability, the 2009 tabulations do as well.
The 2009 asset and liability figures derive from wave 4 of the 2008 SIPP panel. The household interviews were conducted from September to December 2009. Each month, one-quarter of the households were asked about their household net worth as of the last day of the prior month. So the 2009 net worth figures are a composite of the assets and liabilities of households as of August to November 2009.
One of the advantages of the SIPP over other data sources on wealth is the large sample of households that it interviews. The 2009 figures are based on more than 36,000 households (unweighted), including 6,513 households headed by persons younger than 35 and nearly 8,500 headed by adults ages 65 and older.
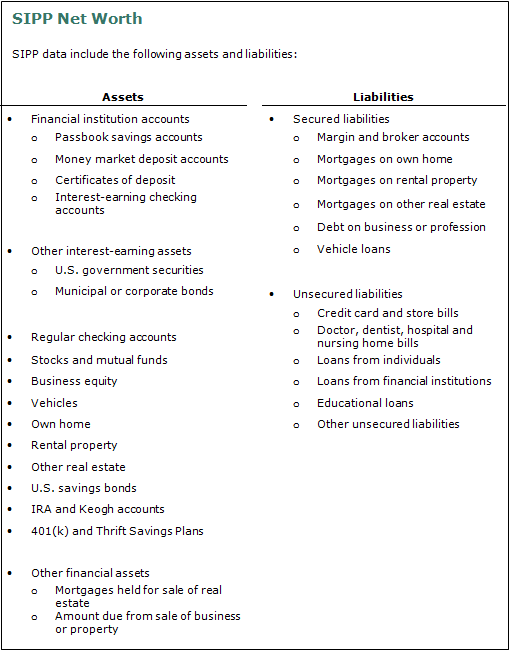
SIPP has consistently asked a detailed set of questions on the assets and liabilities of all household members. Although most of the major forms of asset ownership are included, SIPP does not attempt to measure the value of defined benefit retirement assets, the cash value of life insurance policies, the value of home furnishings and jewelry or the present value of future claims on the Social Security system (“Social Security wealth).” Nor does it look at the value of health insurance.
Current Population Survey
The report presents the conventional data source for the trends in household income and poverty, the U.S. Census Bureau Current Population Survey Annual Social and Economic Supplements (CPS ASEC). The CPS is perhaps best known as the source for the nation’s unemployment rate, as reported on the first Friday of each month by the U.S. Bureau of Labor Statistics. The ASEC is a supplementary survey to the March Current Population Survey and has been collected in a consistent fashion since 1968. The ASEC is the basis for the Census Bureau’s annual household income and poverty report. The CPS is nationally representative, and the ASEC has an unweighted sample size of at least 44,000 households each year (about 75,000 households in more recent years). The report’s tabulations utilized the University of Minnesota Population Center’s integrated public use micro series (IPUMS) version of the ASEC. Further documentation can be found at http://cps.ipums.org/cps/.
Household income refers to the household’s total money income and includes cash income received (exclusive of certain money receipts such as capital gains) before payments for such things as personal income taxes, Social Security, union dues and Medicare deductions. Therefore, money income does not reflect the fact that some families receive non-cash benefits, such as food stamps, health benefits, subsidized housing, and goods produced and consumed on the farm (DeNavas-Walt, Proctor and Smith, 2011).
All monetary values in the report are in 2010 dollars. Following Census Bureau practice, the research series of the consumer price index (CPI-U-RS) is used to inflate earlier years’ nominal dollar amounts to 2010 dollars.
Household income data reported in this study are adjusted for the number of people in a household. That is done because a four-person household with an income of, say, $50,000 faces a tighter budget constraint than a two-person household with the same income. At its simplest, adjusting for household size could mean converting household income into per capita income. Thus, a two-person household with an income of $50,000 would have a per capita income of $25,000, double the per capita income of a four-person household with the same total income.
A more sophisticated framework for household size adjustment recognizes that there are economies of scale in consumer expenditures. For example, a two-bedroom apartment may not cost twice as much to rent as a one-bedroom apartment. Two household members could carpool to work for the same cost as a single household member, and so on. For that reason, most researchers make adjustments for household size using the method of “equivalence scales” (Garner, Ruiz-Castillo and Sastre, 2003, and Short, Garner, Johnson and Doyle, 1999).
A common equivalence-scale adjustment is defined as follows: Adjusted household income = Household income / (Household size)N
By this method, household income is divided by household size exponentiated by “N,” where N is a number between 0 and 1.
Note that if N = 0, the denominator equals 1. In that case, no adjustment is made for household size. If N = 1, the denominator equals household size, and that is the same as converting household income into per capita income. The usual approach is to let N be some number between 0 and 1. Following other researchers, this study uses N = 0.5 (for example, see Johnson, Smeeding and Torrey, 2005). In practical terms, this means that household income is divided by the square root of household size—1.41 for a two-person household, 1.73 for a three-person household, 2.00 for a four-person household, and so on.
Once household incomes have been converted to a “uniform” household size, they can be scaled to reflect any household size. The income data reported in this study are computed for three-person households. That is done as follows:
[(3)0.5]


