
In 2010, the median adjusted household income in the U.S. was $57,297.9
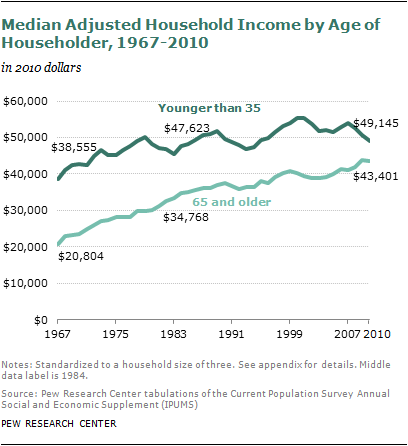
Across age groups, this measure of economic well-being is lowest for the oldest households and highest for those in late middle age. Median adjusted 2010 household income was $49,145 among households headed by adults younger than age 35 and $70,118 in households headed by adults ages 45 to 54. Adjusted income was virtually identical ($69,847) in households headed by adults ages 55 to 64. In households where the head of household is age 65 and older, income drops to $43,401.
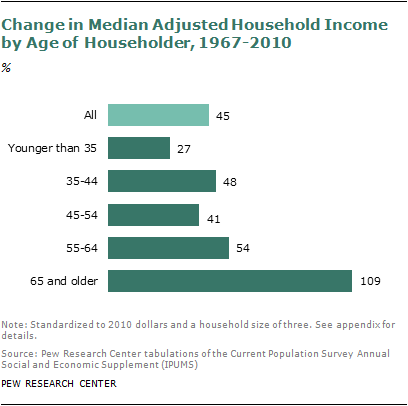
These values reflect marked increases for all groups since 1967, even controlling for inflation. Median adjusted household income increased by 45% during this 43-year period. Increases were smallest for households headed by adults younger than age 35, where incomes rose 27%. Conversely, the income of households headed by adults ages 65 and older more than doubled from 1967 to 2010. Incomes increased by 48% for households headed by 35- to 44-year-olds, by 41% for households headed by 45- to 54-year-olds, and by 54% for households headed by 55- to 64-year-olds.
Changes in household income from 1984 to 2010 are far smaller in magnitude but follow a similar pattern across age groups. Younger households experienced relatively small income increases of 3% over the 26-year period. Income in households headed by adults ages 35 to 44 increased 9%, and the increase was 7% for households headed by adults ages 45 to 54. Older households experienced larger increases—23% in households headed by 55- to 64-year-olds and 25% for households headed by adults ages 65 or older.
The wide variance in income changes across age groups has produced a dramatic narrowing of the adjusted income gap between younger and older households.
In 1967, households headed by adults ages 65 or older had median adjusted household incomes of $20,804—a number that was roughly half (54%) the income of households headed by adults younger than 35 ($38,555). By 1984, household incomes among the oldest adults had risen markedly to $34,768 and incomes for households headed by adults younger than 35 had increased to $47,623.
Flash forward to 2010, and the incomes of older and younger households have converged even more, to $49,145 among those younger than 35 and $43,401 among those ages 65 and older.
Even prior to the recession, the incomes of older households were catching up to those of younger households, but the onset of the recession accelerated this trend. Overall, adjusted household incomes have taken a hit in the period that included the 2007-2009 recession and the following year; this is the case for all households headed by people younger than 65. Losses in median adjusted household income from 2005 to 2010 ranged from 4 percent (for households headed by adults younger than 35) to 10 percent (for households headed by adults ages 45 to 54). Among households headed by people ages 65 and older, however, adjusted household income increased 8 percent above its pre-recession value. The sources of income for households headed by adults ages 65 and older include a steady share of total income, about 55%, from Social Security over more than the past three decades. Consistent with the rising share of older adults who are employed, the share of income in their households from wages and salaries has increased somewhat, from 14% in 2000 to 17% in 2010.
Among households headed by young adults, wages and salaries have dipped as a share of all income, from 87% in 2000 to 82% in 2010. More information on the sources of income in older and younger households can be found in the appendix tables.
Poverty
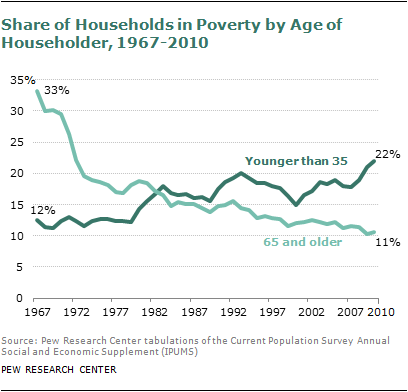
Across time, the share of households in poverty veers in opposite directions for households headed by older and younger adults.
Poverty rates for households headed by adults ages 65 and older dropped dramatically from 1967 to 1980, then continued to decline, albeit more slowly, to the present day. In 2010, 11% of households headed by adults ages 65 and older were in poverty, compared with 33% in 1967.
Poverty rates for households headed by adults younger than 35, meanwhile, began climbing in the 1980s and today are notably higher than they were in 1967. Among households headed by an adult younger than 35, 22% were in poverty in 2010, compared with 12% in 1967.
Among households headed by 35- to 44-year-olds, 9% were in poverty in 1967 and 14% in 2010. Among households headed by 45- to 54-year-olds, 8% were in poverty in 1967 and 12% in 2010. Among households headed by 55- to 64-year-olds, 14% were in poverty in 1967 and 12% in 2010.
In keeping with this report’s focus on households, the analysis of poverty has been computed at the household level. The official U.S. government poverty statistics come from the same data source, the Current Population Survey, but are computed for individuals. Both the household measures and the individual measures show a long-term decline in poverty rates for older Americans.
Employment
The share of older adults who are employed has been growing, while the share of younger adults who are employed has been shrinking. (This section is based on analysis of statistics for people, which differs from the household focus of this report overall.)
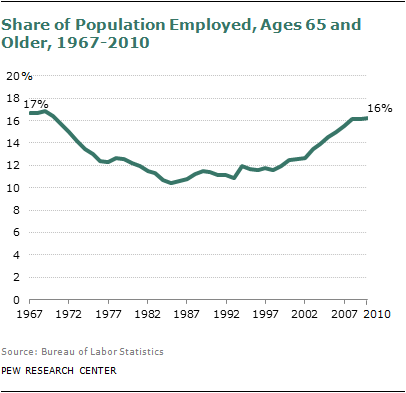
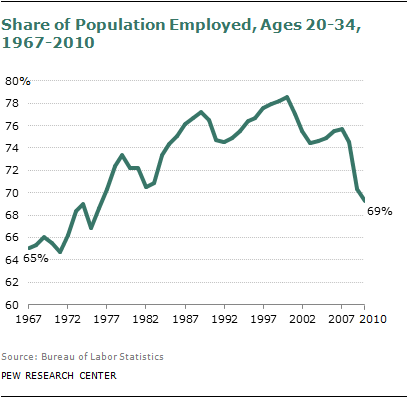
As the accompanying chart shows, the employment rate of the population ages 65 and older, while still less than 20%, has risen over the past decade; the share of 20- to 34-year-olds who are employed has declined over the same period.
The motivation of workers ages 65 and older was explored in a 2009 Pew Research Center survey, which found that 54% say they work because they want to, 17% because they need the money and 27% for a mix of both reasons.10 One reason for the decline in the employment rate among the young is that a growing share are in school, forgoing wages now for potential higher earnings later.11
Unemployment rates for young adults also are higher than for the oldest adults (11.7% compared with 6.7% in 2010), which has been true for many years, according to data from the Bureau of Labor Statistics.


