
Political engagement
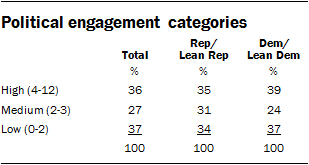
Throughout this report, a three-category measure of political engagement is used. The scale combines how often respondents follow politics, how often they vote and whether they have engaged in any of five political activities in the last five years. The scale is weighted to favor more recent participation (within the last year). The five activities are: attending a political event or rally, volunteering for a political campaign, contacting an elected official, contributing money to a candidate or campaign and attending a government or community meeting. The scale has a range of zero to 12. High engagement individuals score between 4 and 12 on the scale; medium engagement score between 2 and 3 and low engagement score under 2.
Civic knowledge
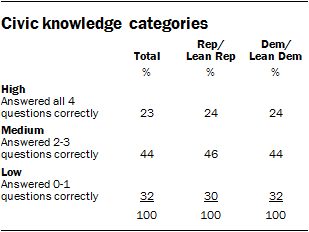
This report uses a three-category measure of civic knowledge. The scale combines four questions about civic knowledge. The questions are who casts tie-breaking votes in the U.S. Senate (Vice President), how many votes are needed to end a filibuster (60), which amendment to the U.S. Constitution determines the number of terms a president can serve (22nd Amendment) and what is the Electoral College (assembly that formally elects the president). Respondents receive one point on the scale for each correct answer, with a maximum score of four.
Congressional district competitiveness scale
For the purposes of this analysis, congressional districts are classified according to the proportion of the two-party vote (i.e., excluding third party candidate vote totals from the denominator). Safe Republican districts are those in which the Republican candidate either ran unopposed or won more than 60% of the two-party vote. Safe Democratic districts are defined as those in which the Democratic candidate either ran unopposed or won more than 60% of the two-party vote. Remaining districts are classified as “swing” districts (the winner of the election won less than 60% of the two-party vote).
Researchers obtained data at the congressional district level in updated replication materials for Gary Jacobson’s “It’s Nothing Personal: The Decline of the Incumbency Advantage in U.S. House Elections,” published in the Journal of Politics.
2016 presidential election competitiveness scale
States are coded according to their competitiveness in the 2016 presidential election. States classified as “red” are solidly Republican states. Those classified as “blue” are solidly Democratic states. “Battleground” states are those where the election was expected to be more competitive. For the purposes of this report, battleground states are: Arizona, Colorado, Florida, Iowa, Maine, Michigan, Minnesota, Nevada, New Hampshire, North Carolina, Ohio, Pennsylvania, Virginia and Wisconsin. “Red” states are: Alabama, Alaska, Arkansas, Georgia, Idaho, Indiana, Kansas, Kentucky, Louisiana, Mississippi, Missouri, Montana, Nebraska, North Dakota, Oklahoma, South Carolina, South Dakota, Tennessee, Texas, Utah, West Virginia and Wyoming. “Blue” states are: California, Connecticut, Delaware, the District of Columbia, Hawaii, Illinois, Maryland, Massachusetts, New Jersey, New Mexico, New York, Oregon, Rhode Island, Vermont and Washington. The pattern of results noted in chapter 5 holds even if borderline cases (e.g., the states of the upper Midwest) are categorized differently.


