
One of the most urgent problems in online opt-in polling is bogus (or fraudulent) respondents. These are survey-takers who make no effort to answer questions truthfully and instead are just looking to finish surveys quickly and collect rewards.
To combat this threat, researchers have developed various ways to identify and purge bogus cases from survey samples. Approaches include 1) trap questions, sometimes called “attention checks,” that genuine respondents should always answer correctly, 2) automated prescreening services, and 3) matching respondents to a registered voter file.
But how well do they work? A new Pew Research Center study finds that:
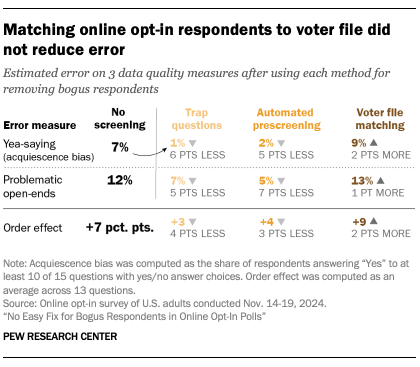
- Overall, purging bogus cases lowers error on most metrics, but a surefire solution remains elusive.
- Matching an opt-in sample to voter files slightly increased error by removing mostly good respondents (e.g., those who simply declined to give their name or address).
- Trap questions and an automated prescreening service performed similarly, improving data quality somewhat.
- All three approaches modestly increased the overestimation of Democratic support in the 2024 election. This appears to be due not to a systematic partisan bias but to bogus respondents’ tendency to say they voted for the winning candidate – in this case, Donald Trump, the Republican.
Matching opt-in samples to voter files may serve other purposes, such as providing data on respondents’ voting history. This study speaks only to whether this is an effective tool for purging bogus cases.
Do all polls have bogus respondents?
No. Bogus respondents are primarily a threat to online opt-in polls, which are recruited through methods like online advertising, self-enrollment and email lists. Polls recruited offline using random sampling (e.g., Pew Research Center’s American Trends Panel) are generally immune to this threat, though they face other challenges.
Related: Do AI and bogus respondents threaten polling’s future?
Methods for removing bogus respondents
Studies conducted by Center researchers and others have found that standard data quality checks such as looking for “speeders” who complete surveys too quickly or “straightliners” who consistently select the same answer choice (e.g., always pick the first response option) fail to detect most bogus respondents. The same goes for many trap questions or attention checks, which not only fail to detect bogus respondents but can also confuse legitimate respondents, leading to false positives.
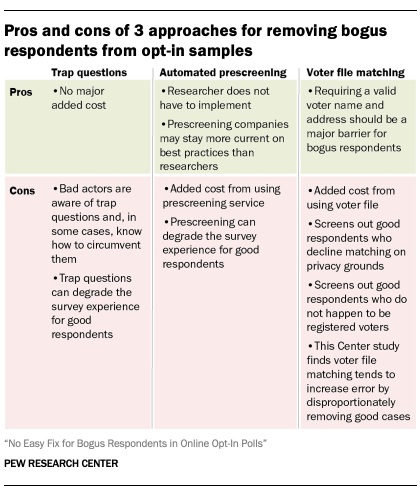
Faced with these challenges, pollsters have developed a variety of new approaches in hopes of better identifying bogus respondents.
In this study, we evaluate three such approaches:
- Trap questions about unlikely behaviors
- Automated prescreening by a leading fraud-detection company
- Matching respondents to a commercial voter file
Trap questions
A difficulty in identifying bogus respondents lies in the fact that, for most questions, we have no way of knowing if a respondent has answered truthfully. To get around this problem, we asked respondents if they had ever engaged in four activities where we can be virtually certain that the true answer is “No.” Under this screening procedure, respondents were coded as bogus if they answered “Yes” to one or more of these questions.
The questions were designed so that diligent respondents would not be confused about how to answer, while bogus respondents trying to appear eligible for surveys targeting specific groups or answering randomly would be more likely to answer “Yes.” Specifically:
- We asked respondents if they used any of six different social media platforms, one of which was a made-up platform called Fizzypress. We also asked if they had received any of six different government benefits in 2023, including payments from the United States Railroad Administration (USRA) – a real government agency, but one that ceased to exist in 1920. Both of these were asked early on in the survey and were intended to resemble screening questions looking for users of specific social media platforms or recipients of certain kinds of benefits. Of the full sample, 6% said they used Fizzypress and 9% claimed to have received USRA payments.
- Later in the survey, we asked respondents if they had ever visited the International Space Station; 10% said they had. Finally, we asked if they had ever served on a Polar-class icebreaker ship, only two of which were ever built and only one of which remains in active use by the U.S. Coast Guard; 8% answered in the affirmative.
A total of 1,963 cases (18%) answered “Yes” to one or more of these trap questions and were flagged as bogus.
Automated prescreening
CloudResearch’s proprietary Sentry prescreening system is designed to automatically identify problematic respondents before they begin a survey. When a potential respondent first clicks the survey invitation link, they are routed to the Sentry platform and asked a short series of questions designed to elicit problematic survey-taking behaviors like yea-saying and inattentive responding. Open-end answers are checked to confirm that they are responsive to the question asked and not pasted from another source via an automated process.
The system also performs passive checks using metadata about the respondent’s device, location and browser for other signs that they are misrepresenting themselves through technical means.
Respondents who pass these checks are then routed to take the survey. Typically, those who fail are not forwarded to the main survey, but for this study, no respondents were terminated for failing the preescreening checks. We used metadata about which cases failed and why to simulate what would have happened to the survey results if they were excluded at the outset.
Under this procedure, 5,369 cases – nearly half of all completes – failed at least one prescreening check, including 1,879 (35% of failed cases) that failed multiple.
- 70% of failed cases had a problematic open-end, making this the most frequently failed check by far. This was followed by yea-saying (47%), inattentiveness (12%) and duplicate IP addresses (10%).
- 7% of these cases failed checks for fraudulent behavior, and only 1% failed other passive technical checks.
Voter file matching
The third approach we tested involves asking respondents to provide their name and address and then looking for a matching record in a commercial voter file, a national database of nearly all registered voters in the United States. If a matching record can be found, the case is considered valid. If no matching record is found, the case is thrown out.
This method assumes that respondents who can be matched are most likely being honest about their identity, and that someone willing to provide detailed contact information that can be validated against official voting records will likely be diligent about answering other survey questions.
This approach has primarily been used by pollsters who work for political campaigns. For cases that are successfully matched, voter files can provide a great deal of information beyond what was asked in the survey, such as a respondent’s registration status and voting history.
But while many voter file vendors attempt to include the unregistered population, Center research has found that a sizable share of this group is not covered by these databases. This can lead to throwing away data for many otherwise-valid respondents who simply aren’t registered to vote. This is not a large drawback for political pollsters, who typically focus on surveying registered voters. But if certain kinds of people who are more likely to be unregistered are underrepresented in a sample or missing altogether, it may lead to biased results if applied to a general population survey.
In this study, we asked respondents if they were willing to provide their name and home address so that they could be matched to the voter file. Out of all respondents, 49% agreed to provide their contact information; of these, 73% were successfully matched to the TargetSmart voter file based on name, address, age and sex. Altogether, 3,977 cases (36% of the full sample) were successfully matched while 7,137 (64%) were screened out under this procedure.
Distinct demographic patterns in flagged cases
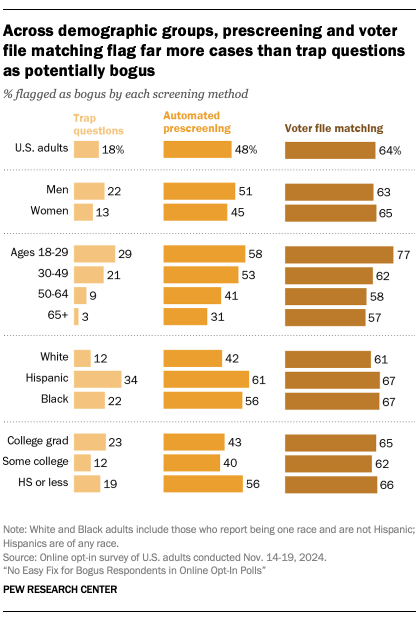
Although the overall number of cases screened out by each method varies dramatically, respondents claiming to have certain demographic characteristics were consistently more likely to be flagged. Specifically, trap questions and prescreening were especially likely to flag those claiming to be ages 18 to 29 or Hispanic – the two groups found to be most affected by bogus responding in previous Center studies.
This should not be taken to mean that members of these demographic groups tend to be poor survey-takers. Rather, insincere respondents tend to claim membership in these groups, likely falsely in many cases.
The profile of cases purged using voter file matching was different. This reflects the fact that voter file matching tends to purge cases for benign reasons (e.g., a respondent’s privacy concerns or their not being a registered voter), not harmful ones. Hispanic cases were no more likely to be screened out than non-Hispanic Black cases, and both were only 6 percentage points more likely to be screened out than non-Hispanic White cases. In contrast, Hispanic cases were more likely to be flagged than non-Hispanic White cases by trap questions (+22 points) and prescreening (+19).
Likewise, trap questions and prescreening were both more likely to flag men than women, by margins of 9 and 6 points, respectively. Men and women were screened out by voter file matching at roughly the same rate.
The three methods differed on education:
- With trap questions, college graduates (+11) and respondents with a high school education or less (+7) were more likely to be flagged than those with some college education.
- With prescreening, high school or less cases (+13) were more likely to be flagged than college graduates, who had the next-highest flag rate.
- Voter file matching showed much less differentiation: Rates across education groups did not vary by more than 4 points.
Effect of screening on measures of data quality
What impact do these three screening methods have on data quality? There is no direct way to know what proportion of bogus respondents are successfully identified by each method, nor can we be sure how many valid cases are misidentified as fraudulent. Instead, we can compare various measures of data quality calculated before and after each screening method has been applied and the flagged cases removed. To ensure that results are comparable across screening methods, separate sets of survey weights were created for the unscreened sample and for the set of cases remaining after each method was applied. For details, refer to the methodology.
In this study, we focused on three measures of data quality: 1) the frequency answering “Yes” to yes/no questions, sometimes called “yea-saying,” 2) the quality of text responses to open-ended questions, and 3) the severity of response order effects when the order of answer choices is randomized.
Yea-saying
In a 2023 Pew Research Center study, one indicator of bogus responding was a tendency to answer yes/no questions in the affirmative, regardless of the question. In that study, 8% of online opt-in respondents answered “Yes” to at least 10 of 16 yes/no questions asked, with especially high shares among 18- to 29-year-olds (15%) and Hispanic respondents (19%). In contrast, the corresponding shares among respondents from probability-based panels fell between 1% and 2%. Many of these questions measured rare or uncommon characteristics, and we would expect that virtually no one answering truthfully would say “Yes” to 10 or more.
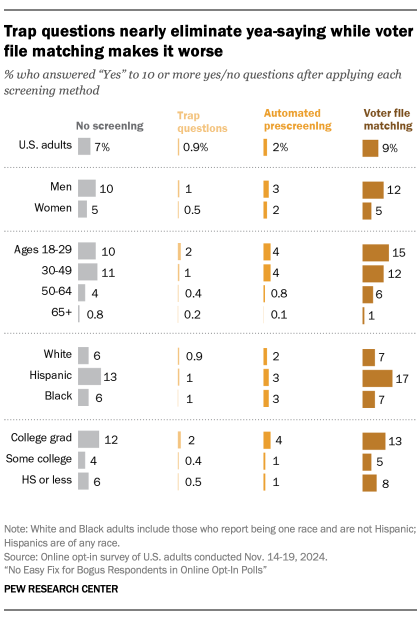
Our latest survey exhibits largely the same pattern. Prior to any screening, 7% of all adults, 10% of 18- to 29-year-olds and 13% of Hispanic respondents answered “Yes” to at least 10 of 15 yes/no questions (excluding a question measuring Hispanic ethnicity and questions used in any screening procedures).
After screening with trap questions, this behavior is largely eliminated from the remaining respondents: 1% of adults and no more than 2% of any demographic subgroup answered 10 or more yes/no questions in the affirmative. The reduction is almost as large for prescreening, which reduced the shares to 2% for all adults, 4% for young adults and 3% for Hispanic adults.
In contrast, matching to the voter file appears to have made the problem worse. The share among all adults increased slightly to 9%, and the shares among young and Hispanic adults rose to 15% and 17%, respectively.
This surprising result appears to be due to two factors. The first is that respondents who declined to provide their contact information – nearly half of the sample – appear much less likely to be bogus than those who agreed to provide this information. Among those who declined, only 3% answered “Yes” to 10 or more yes/no questions, compared with 12% among those who agreed.
The second is that a nontrivial share of bogus respondents were able to provide contact information that was accurate and detailed enough to result in a successful voter file match, though the information provided may not be their own. To the extent that some bogus respondents were successfully removed, it was not enough to offset the loss of valid respondents who declined to share contact information.
Open-end response quality
Examining text answers to open-ended questions has long been considered a reliable way to identify low-quality respondents. While attentive respondents give answers that are relevant to the question asked, bogus respondents often give nonsensical or gibberish answers.
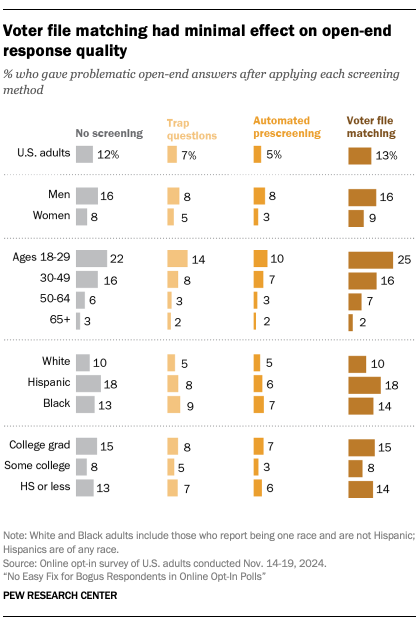
This survey included an open-ended question that asked, “What is one thing that you would like politicians in Washington, D.C. to know about your own situation when they are writing laws and setting policy? Please share as much detail as you can.”
Each respondent’s answer was reviewed and assigned to one the following categories: 1) relevant, 2) nonresponse, 3) generic positive rating, 4) other non sequitur, 5) gibberish, or 6) probable AI (refer to the methodology for details). Because respondents had been told they could skip any question they did not wish to answer, both relevant and nonresponse answers were considered unproblematic, while the remaining categories were deemed problematic.
Prior to any screening, 88% of answers were classified as unproblematic, including 69% that were relevant and 19% that were nonresponse. The most common kind of problematic answers were other non sequiturs (7%), followed by generic positive ratings (2%), gibberish (2%) and probable AI (1%). It is worth noting that the probable AI responses detected were written in a distinct style that was relatively easy to spot. There may be other, more subtle, AI responses that were not detected.
Among all adults, trap questions and prescreening performed similarly, bringing the overall share of problematic open-ends down to 7% and 5%, respectively. Prescreening also resulted in a higher share of relevant answers than trap questions (80% vs. 74%) and a lower share of nonresponse (15% vs. 19%). This may be because the prescreening process itself includes an open-ended question. Matching to voter files, on the other hand, had virtually no effect on the proportion of problematic answers, though the proportion of relevant answers increased to 73%.
Response order effects
If a respondent is being attentive and answering questions accurately, the answer options they select shouldn’t be affected by the order in which they are presented. But inattentive respondents in online surveys tend to select answer choices that appear toward the top of the list, otherwise known as a “primacy effect.”
Our survey included a question asking if undocumented immigrants should be allowed to remain in the country, after which a random half of respondents were shown answer choices in the following order:
- “They should not be allowed to stay in the country legally.”
- “There should be a way for them to stay in the country legally, if certain requirements are met.”
For the other half of respondents, this order was reversed. If all respondents were answering diligently, the results from each half of the sample would be largely the same.
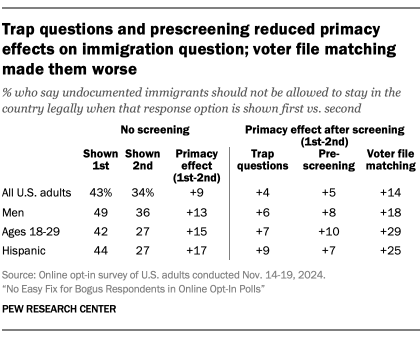
Instead, we saw a substantial primacy effect on this question. Without any screening, 43% of adults endorse the view that undocumented immigrants should not be allowed to stay legally when that option is presented first. The share drops to 34% when the order is reversed, a primacy effect of +9 percentage points.
The primacy effects were even larger for those subgroups most affected by bogus responding, at +13 points for men, +15 points for 18- to 29-year-olds and +17 points for Hispanic adults.
- Screening with trap questions reduced the primacy effect by roughly half, to +4 points for all adults, +6 for men, +7 for young adults and +9 for Hispanic adults.
- Prescreening performed similarly, reducing the primacy effect to between +5 and +10 points.
- Voter file matching, on the other hand, resulted in even larger primacy effects than when there was no screening at all, with magnitudes increasing to +14 for all adults, +18 for men, +29 for young adults and +25 for Hispanic adults.
As with the frequency of giving “Yes” answers, voter file matching’s negative impact on data quality appears to be due to valid respondents choosing not to provide contact information for matching, with those cases showing a primacy effect of only +2 points.
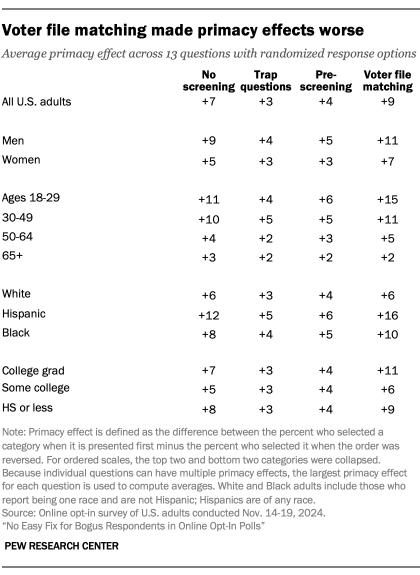
Including the question about the status of undocumented immigrants, there were a total of 13 questions with randomized response options that were asked of all respondents. Nearly all of these showed the same pattern. Without any screening, the average primacy effect on these questions was +7 percentage points for all adults, and as high as +11 and +12 points for young adults and Hispanic adults, respectively. Trap questions reduced the average primacy effect by 4 points for all adults and by 7 points for young and Hispanic adults, while prescreening did almost as well.
How does screening affect questions about voter turnout and vote choice?
The prevalence of online opt-in samples in election polling raises the question of how different screening methods – voter file matching in particular – impact estimates related to voter turnout and vote choice. Fielded shortly after the 2024 U.S. presidential election, this survey asked respondents if they voted, and if so, for whom.
Without any screening, an estimated 84% of self-reported registered voters said they voted in the 2024 presidential election. Purging cases with trap questions and prescreening both increased that share by 3 points, to 87%, while voter file matching increased it by 1 point, to 85%. This pattern is more pronounced among young adults and Hispanic adults: For these groups, trap questions and prescreening increased estimated turnout by between 6 and 9 percentage points, while voter file matching produced a 1-point increase among young adults and a 2-point decrease among Hispanic adults.
Although an increase in voter turnout would appear to make these estimates less accurate relative to a higher quality estimate of roughly 77%, it is notable that, for this question, the order of response options was not randomized and the response option for having voted was presented last.1 This kind of pattern is what we would expect to see if bogus respondents, who are more likely to select answer choices toward the top of the list, are being screened out. The fact that the effect is smaller for voter file matching is also consistent with that method’s tendency to disproportionately exclude valid respondents.
All three screening methods increased estimated support for Harris
When it comes to presidential vote (for which response option order was randomized), the weighted raw sample showed Donald Trump and Kamala Harris tied, each with 48% of the vote – accurate to Harris’ true vote share, but underestimating Trump’s by 2 points. Trap questions slightly shifted the result from a tie to a 3-point advantage for Harris. The effect was larger for prescreening and voter file matching, which shifted Harris’ margin to +6 and +7 points, respectively.
These patterns suggest that Harris supporters are overrepresented among valid respondents. But prior to screening, this bias was largely offset by the presence of bogus respondents, who disproportionately said they supported Trump. When bogus respondents were screened out, the bias in favor of Harris became more apparent.
Because the answer choices for Trump and Harris were randomized, this result also implies that bogus respondents were not simply choosing the first option or choosing randomly. There appears to be a subset of bogus respondents, specifically those with the most glaring data quality problems, who were much more likely to say that they voted for Trump, regardless of whether that option was presented first or second. For example, in the unscreened sample, cases coded as having a problematic open-end supported Trump over Harris by a margin of 29 percentage points, while cases that gave 10 or more “Yes” answers favored Trump by 30 points.
Cases with one or both of these data quality problems made up anywhere from 11% of screenouts from voter file matching up to 57% of screenouts from trap questions.
This should not be taken to mean that bogus respondents will always be systematically biased in favor of Republican candidates. In a previous Center benchmarking study where respondents were asked about the 2020 presidential election, opt-in respondents who gave 10 or more “Yes” answers claimed to have voted for Joe Biden, the Democrat, over Trump by margins ranging from 34 to 51 points across three different opt-in samples. It seems plausible that, when asked about past elections, many of these respondents are simply choosing the candidate who won.
These effects are even larger for subgroups in which bogus respondents are most common. Among 18- to 29-year-old voters, the survey initially showed Trump ahead by 2 points prior to screening. All three screening approaches shifted the margin in favor of Harris, putting her ahead by 3 points with trap questions, 6 points with prescreening and 1 point with voter file matching. Among Hispanic voters, trap questions slightly decreased Harris’ lead from 9 points to 8. Prescreening and voter file matching had larger effects, increasing Harris’ lead among Hispanic voters to 16 and 19 points, respectively.
CORRECTION (Aug. 28, 2026): The following sentence was updated to reflect the correct percentages for all U.S. adults, young adults (ages 18 to 29) and Hispanic adults: “The share among all adults increased slightly to 9%, and the shares among young and Hispanic adults rose to 15% and 17%, respectively.” Figures were correct in the corresponding graphic; this change does not affect other findings reported.


