
Pew Research Center designed this study to assess the current state of online survey sampling methods – both probability-based and opt-in – and determine their accuracy on general population estimates for all U.S. adults and on estimates for key demographic subgroups. To do this, we administered a common questionnaire to samples obtained from three probability-based online panels, one of which was the Center’s American Trends Panel (ATP), and three online opt-in sample providers. The surveys were administered between June 14 and July 21, 2021, and included interviews with a total of 29,937 U.S. adults.
The target size for each sample was 5,000 adults to minimize the impact of sampling error on estimates for demographic subgroups that comprise only a small percentage of the total U.S. population. Because the purpose of this study is methodological, the names of the vendors are masked. Instead, we refer to the samples as probability panels 1, 2 and 3 and opt-in samples 1, 2, and 3 throughout this report.
The probability-based panels use traditional probability-based methods for recruiting a random sample of U.S. adults. Specifically, all three panels use address-based sampling (ABS) for panel recruitment. ABS begins with a random sample of households from the U.S. Post Office’s Delivery Sequence File, a near complete list of all residential addresses in the United States. Individuals in sampled households are contacted via mail and invited to join the panel and continue taking surveys periodically online. Although all three panels use similar methods for recruitment, differences in the timing and design of recruitments, the use of incentives, sampling procedures for individual panel waves, and panel maintenance practices could result in samples that are not altogether comparable to one another.
The three opt-in samples in this study are based on different but common approaches to online opt-in sampling. Opt-in sample 1 comes from a panel aggregator, or marketplace, in which individual respondents are drawn from many opt-in sample sources that have agreed to make their sample available to the aggregator. Opt-in sample 2 is sourced entirely from a single opt-in panel. Opt-in sample 3 is a blend, with about three-fifths sourced from a single opt-in panel and the remainder sourced from three sample aggregators. All three opt-in samples use a common set of quotas on age by gender, race and ethnicity, and educational attainment.
The same weighting scheme was applied to all six samples following Pew Research Center’s standard procedure for weighting the ATP. Complete details of the weighting procedure and the design of the individual samples can be found in the methodology.
Probability-based panel: This refers to a national survey panel recruited using random sampling from a database that includes most people in the population. Today, most such panels in the United States recruit by drawing random samples of residential addresses or telephone numbers. Typically, data collection with these panels is done online. However, some of these panels interview a small fraction of respondents (usually about 5% or fewer) using an offline mode such as live telephone. These panels are “probability-based” because the chance that each address or phone number is selected is known. However, the chance that each selected person will join the panel or take surveys after joining is not known.
Online opt-in sample: These samples are recruited using a variety of methods that are sometimes referred to as “convenience sampling.” Respondents are not selected randomly from the population but are recruited from a variety of online sources such as ads on social media or search engines, websites offering rewards in exchange for survey participation, or self-enrollment in an opt-in panel. Some opt-in samples are sourced from a panel (or multiple panels), while others rely on intercept techniques where respondents are invited to take a one-off survey.
Benchmark: These are “ground-truth” measures used to assess the accuracy of survey estimates. For example, survey-based estimates for the share of voters who voted for each candidate in the 2020 presidential election are compared to a benchmark based on an official tally by the Federal Election Commission (FEC). Survey estimates are deemed more accurate the closer they are to the benchmark value. In this study, the benchmarks come from high-quality federal surveys such as the American Community Survey or administrative records like the FEC vote tally. Although these benchmarks come from “gold-standard” data sources, they are not entirely free from error. As such, they are not “true” population values but rather the best available approximations.
Error: This is the difference between an individual survey estimate and its corresponding benchmark value. Error can be either positive or negative depending on whether the survey estimate is higher or lower than the benchmark. For example, the FEC benchmark for the share of voters who voted for Donald Trump in the 2020 presidential election is 47%. If a survey estimated that share to be 42%, the error would be -5 percentage points because it came in 5 points below the benchmark. If the estimate were 49%, the error would be +2 points.
Absolute error: This is the absolute value of the error for a survey estimate. It describes the size of the error irrespective of its direction (positive or negative). For example, two estimates that have error of +5 and -5 percentage points, respectively, both have an absolute error of 5 points.
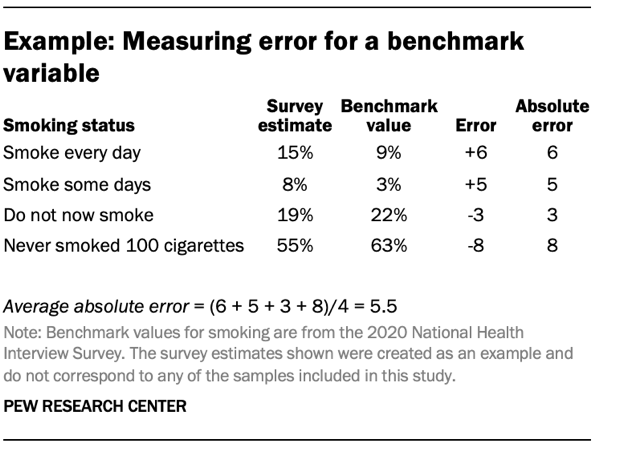
Average absolute error (for a benchmark variable): This is a measure that summarizes the average size of errors across all the categories within a single benchmark variable. For example, the smoking status variable has four categories: 1) Smoke every day, 2) Smoke some days, 3) Do not now smoke and 4) Never smoked 100 cigarettes. A survey’s estimates for each category will have different levels of error, both positive and negative. For a given survey, the absolute error for the smoking status variable is equal to the sum of the absolute errors for each category divided by the number of categories.
Average absolute error (for a sample): Average absolute error can also be used to summarize the overall level of error across many different benchmarks within a single sample. When used in this context, the average absolute error for a sample is equal to the sum of the average absolute errors for each benchmark variable divided by the total number of benchmark variables.
As the field of public opinion research continues its steady movement toward online data collection, probability-based panels and opt-in samples have emerged as the two most common approaches to surveying individuals online. At the same time, the methodologies and industry practices for both kinds of samples are evolving.
To shed light on the current state of online probability-based and opt-in samples, Pew Research Center conducted a study to compare the accuracy of six online surveys of U.S. adults – three from probability-based panels and three from opt-in sources. This is the first such study to include samples from multiple probability-based panels, allowing for their side-by-side comparison.
The surveys in this study were administered between June 14 and July 21, 2021, and included interviews with a total of 29,937 U.S. adults, approximately 5,000 in each sample. Because this is a methodological study, the names of the sample providers are masked.
The study compared each sample’s accuracy on 28 benchmark variables drawn from high-quality government data sources. These benchmarks included a variety of measures on topics such as voting, health, and respondents’ work, family and living situations. (Refer to the appendix for the full list of benchmarks and their sources.)
The study’s key findings include:
On average, error on opt-in samples was about twice that of probability-based panels
For estimates among U.S. adults on 28 benchmark variables, opt-in samples 1, 2 and 3 had average absolute errors of 6.4, 6.1 and 5.0, respectively, for an overall average of 5.8 percentage points. This was about twice that of the probability-based online panels, for which average absolute error was 2.6 points overall (2.3, 3.0 and 2.5 on probability panels 1, 2 and 3, respectively).
Online opt-in samples had especially large errors for 18- to 29-year-olds and Hispanic adults
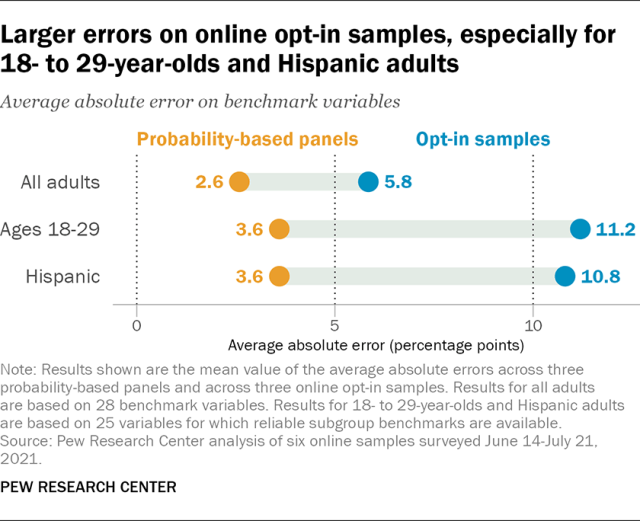
On 25 variables for which subgroup-level benchmarks were available, the online opt-in samples averaged 11.2 percentage points of error for 18- to 29-year-olds and 10.8 points for Hispanic adults– each about 5 points higher than for U.S. adults overall (6.4 points on the same 25 variables). By comparison, the average absolute error on the probability-based panels was 3.6 points for both young adults and Hispanic adults, less than 2 points higher than the error for all adults. A similar level of error was seen on the probability-based panels for other traditionally hard-to-survey subgroups such as those with no more than a high school education (3.6 points) and non-Hispanic Black adults (3.8 points).
Error was concentrated in a handful of variables on the probability-based panels but widespread on the opt-in samples
On each of the probability-based panels, the number of benchmarks for which average absolute error was greater than 5 percentage points ranged from two to five out of 28. About half (between 14 and 15 benchmarks) had under 2 points of average absolute error. Large errors were more widespread on the opt-in samples, which had between 11 and 17 benchmarks with error greater than 5 points. Fewer benchmarks (between three and seven) on the opt-in samples had average absolute error below 2 points.
Probability-based panels consistently overestimated 2020 voter turnout
The only benchmark that had consistently high error on all three probability-based panels was voter turnout in the 2020 presidential election, which they each overestimated by +8 or +9 percentage points. This suggests that despite the inclusion of volunteerism and voter registration in weighting adjustments, the overrepresentation of politically and civically engaged individuals remains an important challenge for probability-based panels. By contrast, turnout was one of the most accurate variables on the opt-in samples, two of which came within 1 point of the benchmark while the third exceeded the benchmark by +3 points.
Much of the error on the opt-in samples appears to be due to ‘bogus respondents,’ who usually say ‘Yes’ regardless of the question
In the online opt-in samples, an average of 8% of all adults, 15% of 18- to 29-year-olds and 19% of Hispanic adults answered “Yes” on at least 10 out of 16 Yes/No questions that were asked of every respondent. The corresponding shares on the probability-based panels were between 1% and 2% for each group. Similarly large shares reported having received at least three of four types of government benefits (Social Security, food stamps, unemployment compensation or workers’ compensation) even though such individuals are virtually nonexistent in the true population. It is highly unlikely that the few individuals who do fit that description are massively overrepresented in online opt-in samples. Instead, this pattern suggests that much of the error on the online opt-in samples is due to the presence of “bogus respondents,” who make little or no effort to answer questions truthfully.
What is new about this benchmarking study?
Polling insiders may wonder why we conducted this study. Other research teams (including our own several years ago) have done similar comparisons and arrived at the same result: Probability-based samples tend to be more accurate, even if recent election polls are an exception.
One major reason we conducted this study is because it offers something new. This benchmarking study is the first to estimate the accuracy of multiple online probability-based panels in the United States. This allows us to answer a previously unaddressed question: Do different probability-based panels tend to offer similar data quality or not? The three probability-based panels tested in this study performed about the same. The average absolute error ranged from just 2.3 to 3.0 percentage points – good news for researchers seeking a reliable polling method. It’s worth noting that this study considered fairly general topics (e.g., employment, marital status), and that the results might differ if a survey focused on a more niche topic, like poverty.
The second major reason we conducted this study was that in the time since our 2016 study, there have been a number of major changes to the ATP’s methodology made in response to that study’s findings, other challenges that have arisen in the intervening years, and the Center’s evolving research needs:
- We changed how we recruit, moving from telephone to an address-based approach.
- We began subsampling the panel rather than routinely interviewing everyone.
- We changed how we weight the panel, adding in adjustments for volunteerism, religion and other factors.
- We began retiring panelists from overrepresented segments of the population.
The study reported here is, in part, our effort to measure whether those improvements made a difference, allowing us to determine how the new, improved ATP stacks up against opt-in samples and against other probability-based panels.


