
Probability-based panel: This refers to a national survey panel recruited using random sampling from a database that includes most people in the population. Today, most such panels in the United States recruit by drawing random samples of residential addresses or telephone numbers. Typically, data collection with these panels is done online. However, some of these panels interview a small fraction of respondents (usually about 5% or fewer) using an offline mode such as live telephone. These panels are “probability-based” because the chance that each address or phone number is selected is known. However, the chance that each selected person will join the panel or take surveys after joining is not known.
Online opt-in sample: These samples are recruited using a variety of methods that are sometimes referred to as “convenience sampling.” Respondents are not selected randomly from the population but are recruited from a variety of online sources such as ads on social media or search engines, websites offering rewards in exchange for survey participation, or self-enrollment in an opt-in panel. Some opt-in samples are sourced from a panel (or multiple panels), while others rely on intercept techniques where respondents are invited to take a one-off survey.
Benchmark: These are “ground-truth” measures used to assess the accuracy of survey estimates. For example, survey-based estimates for the share of voters who voted for each candidate in the 2020 presidential election are compared to a benchmark based on an official tally by the Federal Election Commission (FEC). Survey estimates are deemed more accurate the closer they are to the benchmark value. In this study, the benchmarks come from high-quality federal surveys such as the American Community Survey or administrative records like the FEC vote tally. Although these benchmarks come from “gold-standard” data sources, they are not entirely free from error. As such, they are not “true” population values but rather the best available approximations.
Error: This is the difference between an individual survey estimate and its corresponding benchmark value. Error can be either positive or negative depending on whether the survey estimate is higher or lower than the benchmark. For example, the FEC benchmark for the share of voters who voted for Donald Trump in the 2020 presidential election is 47%. If a survey estimated that share to be 42%, the error would be -5 percentage points because it came in 5 points below the benchmark. If the estimate were 49%, the error would be +2 points.
Absolute error: This is the absolute value of the error for a survey estimate. It describes the size of the error irrespective of its direction (positive or negative). For example, two estimates that have error of +5 and -5 percentage points, respectively, both have an absolute error of 5 points.
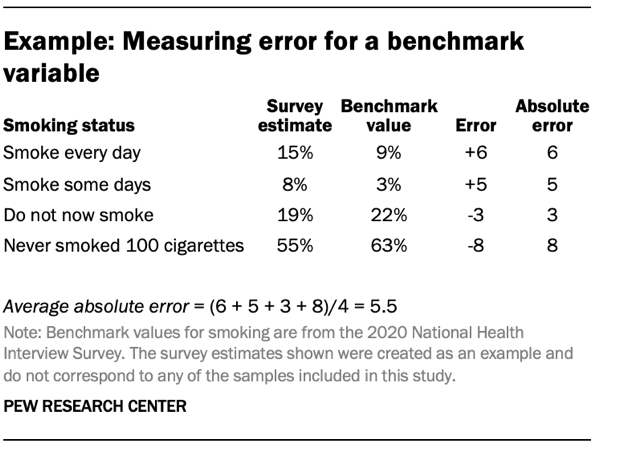
Average absolute error (for a benchmark variable): This is a measure that summarizes the average size of errors across all the categories within a single benchmark variable. For example, the smoking status variable has four categories: 1) Smoke every day, 2) Smoke some days, 3) Do not now smoke and 4) Never smoked 100 cigarettes. A survey’s estimates for each category will have different levels of error, both positive and negative. For a given survey, the absolute error for the smoking status variable is equal to the sum of the absolute errors for each category divided by the number of categories.
Average absolute error (for a sample): Average absolute error can also be used to summarize the overall level of error across many different benchmarks within a single sample. When used in this context, the average absolute error for a sample is equal to the sum of the average absolute errors for each benchmark variable divided by the total number of benchmark variables.
To gauge each sample’s accuracy on general population estimates for all U.S. adults, we calculated the weighted percentage of adults belonging to 77 categories across 28 different variables and compared them to corresponding benchmarks derived from high-quality government data sources. The benchmarks covered a variety of topics, including voting, health, and respondents’ work, family and living situations. (Refer to the appendix for the full list of benchmarks and their sources.)
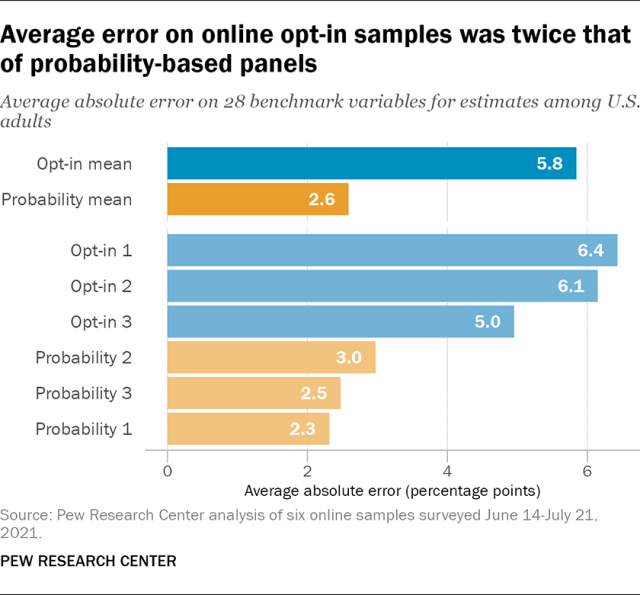
Because many of the benchmark variables included more than one category, we calculated each variable’s average absolute error – that is, the average of the absolute differences between the survey estimate and a corresponding benchmark value for each category – to compare the relative accuracy of variables that have different numbers of categories. To facilitate more general comparisons between samples overall, we also calculated the average absolute error for each sample as the mean of the average absolute errors across all 28 benchmarks.
In any study of this kind, it is important to note that the performance of any given sample depends on numerous factors such as the variables used in weighting or the specific topics included in the benchmarks. It is possible that the relative accuracy of each sample might differ if we had used a different weighting scheme or chosen a different set of benchmarks for comparison. Furthermore, not even “gold-standard” government statistics are entirely free from error. Consequently, the measures of error discussed in this report should be considered approximate.
Across all 28 benchmarks combined, the probability-based panels had a mean average absolute error of 2.6 percentage points for estimates among all U.S. adults. The error for individual probability-based panels ranged from a low of 2.3 points for probability panel 1 to a high of 3.0 points for probability panel 2. The average absolute error for the opt-in samples combined was about twice as large at 5.8 points. Of these, opt-in sample 3 had the lowest average error at 5.0 points. Opt-in samples 1 and 2 exhibited higher error on average with 6.4 and 6.1 points, respectively.
For ease of explanation, individual benchmark variables whose average absolute error was less than 2 percentage points were classified as having “low” error. Variables with more than 5 points of average absolute error were defined as having “high” error, and the remainder were coded as having “medium” error. These particular groupings were chosen because they each contain about one-third of all benchmarks from all six samples. It is important to note that these designations of low, medium or high error are relative to the specific benchmarks and samples included in this study.
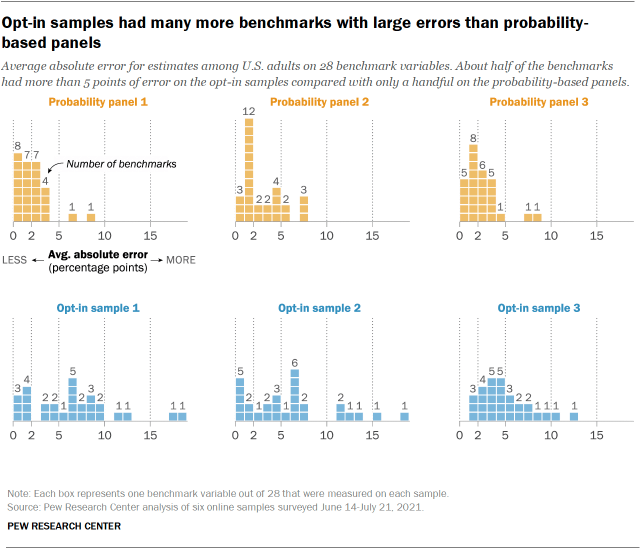
Collectively, about half of all benchmarks on the probability-based panels fell into the low error category (44 out of 84) while 11% were classified as high error (9 out of 84). The only variable with consistently high error on the probability-based panels was voter turnout in the 2020 presidential election, for which all three samples overestimated the benchmark by +8 or +9 percentage points. This is consistent with our 2016 study, which found civically engaged adults to be overrepresented on the American Trends Panel, and suggests that the problem afflicts ABS-recruited panels more generally.
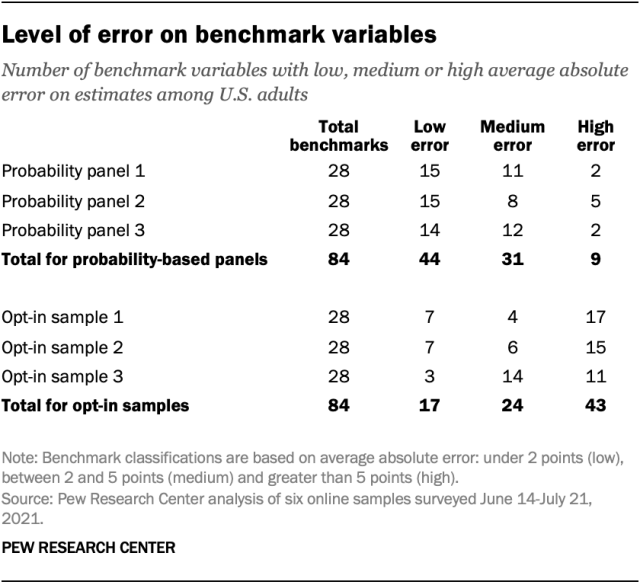
This overall pattern was reversed for the opt-in samples, on which 51% of benchmarks fell in the high error category, compared with 20% in the low error category. There were 10 variables with consistently high error on the opt-in samples. Four involved the receipt of certain government benefits in the prior year. On average, the opt-in samples overestimated the shares of adults receiving food stamps (+16 points), Social Security (+15 points), unemployment compensation (+10 points) and workers’ compensation (+9 points).
Another three variables with consistently high error related to employment, with the opt-in samples underestimating the share of all adults who worked for pay in the prior week by -12 points on average and the share of adults who worked at a job or business at any time in the prior year by -11 points on average. The opt-in samples also overstated the share of adults who were employed but had been unable to work in the past month because of COVID-19 by an average of +7 points.
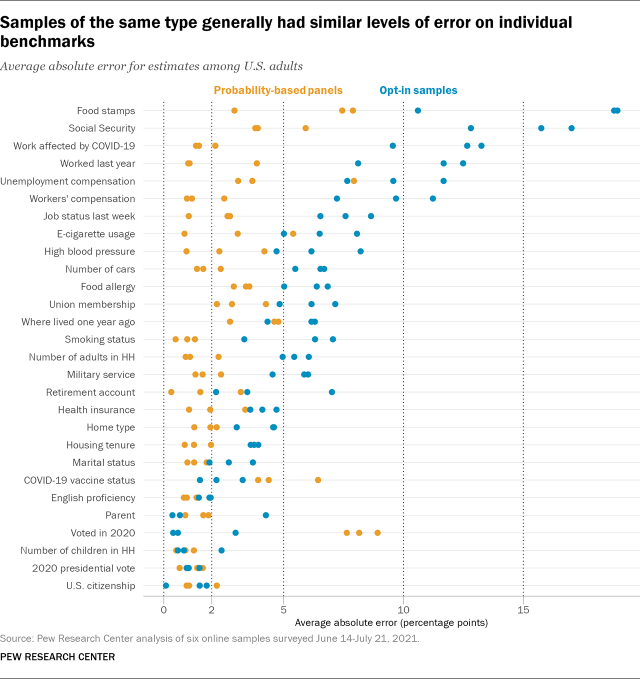
Two health-related benchmarks also saw consistently high error on the opt-in samples. Specifically, all of the opt-in samples exceeded the national benchmark for the share of adults with a food allergy (9%) by +6 points on average. They also understated the share of adults who have never tried vaping by -12 points and overstated the share who currently vape some days or every day by +8 and +5 points on average, respectively. Finally, all three opt-in samples overstated the share of adults who live in carless or single-car households by an average of +6 and +15 points, respectively.
At the other end of the spectrum, there were seven variables with consistently low error on all three probability-based panels. These included parental status, number of children in the household, marital status, housing tenure, smoking status, English language proficiency and candidate vote share in the 2020 presidential election. Two of these, English proficiency and 2020 vote share, also had consistently low error on all three opt-in samples. Citizenship status also had consistently low error on the opt-in samples.


