
The data in this report are drawn from six online surveys of U.S. adults conducted between June 14 and July 21, 2021. Three of the samples were sourced from different probability-based online panels, one of which was Pew Research Center’s American Trends Panel (ATP). The remaining three samples came from three different online opt-in sample providers. The study included interviews with a total of 29,937 U.S. adults, approximately 5,000 in each of the samples. Interviews were conducted in both English and Spanish. Because the purpose of this study is methodological, the names of the vendors are masked and the samples are referred to as probability panels 1, 2 and 3 and opt-in samples 1, 2 and 3.
The ATP cases were surveyed using normal procedures. For probability panel 3, the survey was programmed and administered by the vendor who administers that panel. The surveys for the remaining probability-based panel and the three opt-in samples were programmed and administered by a coordinating vendor. The research aims of the study were not discussed with the coordinating vendor and only the questionnaire was provided to the coordinating vendor in advance. On the probability panels, some questions were not asked if a comparable profile variable from a previous survey could be used instead. These questions are identified in the questionnaire.
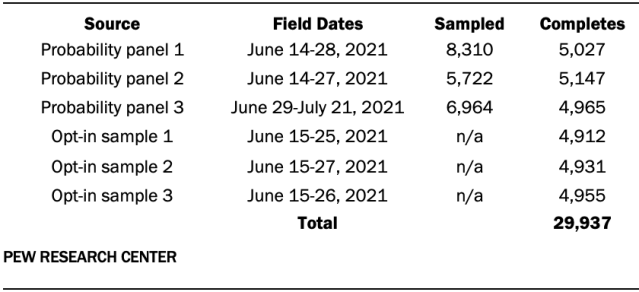
Probability panel 1 had a study-specific response rate of 61%. The cumulative response rate to the survey (accounting for nonresponse to recruitment, to the current survey and for panel attrition) was 1.4%.
Probability panel 2 had a study-specific response rate of 90%. The cumulative response rate to the survey (accounting for nonresponse to recruitment, to the current survey and for panel attrition) was 3%.
Probability panel 3 had a study-specific response rate of 71%. The cumulative response rate to the survey (accounting for nonresponse to recruitment, to the current survey and for panel attrition) was 7%.
Sample design
The probability-based panels used in this study all currently recruit using address-based sampling (ABS) in which a random sample of households selected from the U.S. Postal Service’s Delivery Sequence File. This Postal Service file has been estimated to cover as much as 98% of the population, although some studies suggest that the coverage could be in the low 90% range. 2
The ATP cases included in this study are a subset of the respondents to ATP Wave 91. All 11,699 active ATP members were invited to participate in Wave 91, of which 10,606 completed the survey. To achieve an analytic sample of ATP respondents equivalent in size to the other samples included in this study, we drew a stratified random sample of the 11,699 active panelists following the procedure that would have been used to obtain a target sample size of n=5,000 on Wave 91. The panelists who were both selected for this analytic sample and completed Wave 91 are treated as completes for purposes of inclusion in this study. This is the exact set of respondents who would have been observed if only the subsample of the panel had been invited. The remaining probability-based samples were selected following each vendor’s normal procedure for achieving a target sample size of n=5,000 U.S. adults.
The three opt-in samples in this study each use a different approach to online opt-in sampling. Opt-in sample 1 comes from a panel aggregator, or marketplace, in which individual respondents are drawn from many opt-in sample sources that have agreed to make their sample available to the aggregator. Opt-in sample 2 is sourced entirely from a single opt-in panel. Opt-in sample 3 is a blend, with about three-fifths sourced from a single opt-in panel and the remainder sourced from three sample aggregators.
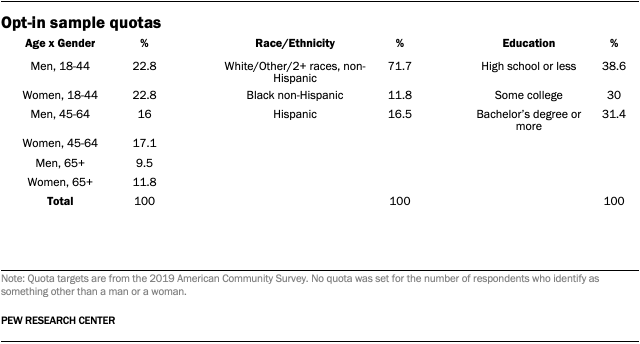
All three opt-in samples set quotas for age by gender, race and ethnicity, and education based on estimates from the 2019 American Community Survey.
Data quality checks
No special data quality checks were performed on any of the probability-based panels. For the opt-in samples, the coordinating vendor applied checks for speeding, straightlining and duplicate cases along with other proprietary data quality checks. As a result, a total of 104 cases from opt-in sample 1, 86 from opt-in sample 2, and 69 from opt-in sample 3 were removed for poor data quality.
Weighting
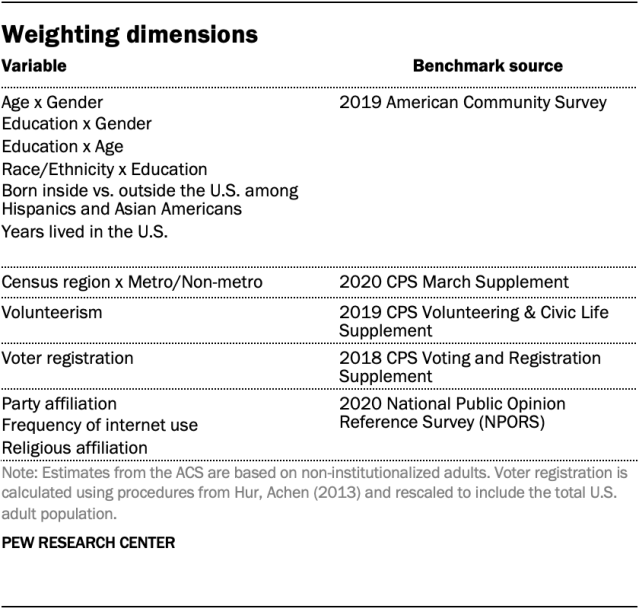
All six samples were weighted following the standard procedure used on ATP Wave 91. For the probability-based panels, this began with a base weight that accounted for differential probabilities of being invited to join the panel, adjustments for panel attrition, and the probability that each panelist was invited to participate in this specific survey. Base weights for each panel were provided by their vendors. Because opt-in samples do not have any known probabilities of selection, all respondents in the opt-in samples were assigned a base weight of 1. The base weight for each sample was then calibrated to align with population benchmarks listed in the accompanying table.


