
What share of U.S. adults have high-speed internet at home? Own a smartphone? Use social media?
Pew Research Center has long studied tech adoption by interviewing Americans over the phone. But starting with the publications released today, we’ll be reporting on these topics using our National Public Opinion Reference Survey (NPORS) instead. The biggest difference: NPORS participants are invited by postal mail and can respond to the survey via a paper questionnaire or online, rather than by phone.
To explain the thinking behind this change and its implications for our future work, here’s a conversation with Managing Director of Internet and Technology Research Monica Anderson and Research Associate Colleen McClain. This interview has been condensed and edited for clarity.
Pew Research Center has been tracking tech adoption in the United States for decades. Why is this area of study so important?

Anderson: We see this research as foundational to understanding the broader impact that the internet, mobile technology and social media have on our society.
Americans have an array of digital tools that help them with everything from getting news to shopping to finding jobs. Studying how people are going online, which devices they own and which social media sites they use is crucial for understanding how they experience the world around them.
This research also anchors our ongoing work on the digital divide: the gap between those who have access to certain technologies and those who don’t. It shows us where demographic differences exist, if they’ve changed over time, and how factors like age, race and income may contribute.
Our surveys are an important reminder that some technologies, like high-speed internet, remain out of reach for some Americans, particularly those who are less affluent. In fact, our latest survey shows that about four-in-ten Americans living in lower-income households do not subscribe to home broadband.
Why is your team making the switch from phone surveys to the National Public Opinion Reference Survey (NPORS)?

McClain: The internet hasn’t just transformed Americans’ everyday lives – it’s also transformed the way researchers study its impact. The changes we’ve made this year set us up to continue studying tech adoption long into the future.
We began tracking Americans’ tech use back in 2000. At that point, about half of Americans were online, and just 1% had broadband at home. Like much of the survey research world, we relied on telephone polling for these studies, and this approach served us well for decades.
But in more recent years, the share of people who respond to phone polls has plummeted, and these types of polls have become more costly. At the same time, online surveys have become more popular and pollsters’ methods have become more diverse. This transformation in polling is reflected in our online American Trends Panel, which works well for the vast majority of the Center’s U.S. survey work.
But there’s a caveat: Online-only surveys aren’t always the best approach when it comes to measuring certain types of data points. That includes measuring how many people don’t use technology in the first place.
Enter the National Public Opinion Reference Survey, which the Center launched in 2020 to meet these kinds of challenges. By giving people the choice to take our survey on paper or online, it is especially well-suited for hearing from Americans who don’t use the internet, aren’t comfortable with technology or just don’t want to respond online. That makes it a good fit for studying the digital divide. And NPORS achieves a higher response rate than phone polls.
Shifting our tech adoption studies to NPORS ensures we’re keeping up with the latest advances in the Center’s methods toolkit, with quality at the forefront of this important work.
The internet hasn’t just transformed Americans’ everyday lives – it’s also transformed the way researchers study its impact. The changes we’ve made this year set us up to continue studying tech adoption long into the future.
Colleen McClain
Are the old and new approaches comparable?
McClain: We took several steps to make our NPORS findings as comparable as possible with our earlier phone surveys. We knew that it can be tricky, and sometimes impossible, to directly compare the results of surveys that use different modes – that is, methods of interviewing. How a survey is conducted can affect how people answer questions and who responds in the first place. These are known as “mode effects.”
To try to minimize the impact of this change, we started by doing what we do best: gathering data.
Around the same time that we fielded our phone polls about tech adoption in 2019 and 2021, we also fielded some surveys using alternate approaches. We didn’t want to change the mode right away, but rather understand how any changes in our approach might affect the data we were collecting about how Americans use technology.
These test runs helped narrow our options and tweak the NPORS design. Using the 2019 and 2021 phone data we collected as a comparison point, we worked over the next few years to make the respondent experience as similar as possible across modes.
What does your new approach mean for your ability to talk about changes over time?
McClain: We carefully considered the potential for mode effects as we decided how to talk about the changes we saw in our findings this year. Even with all the work we did to make the approaches as comparable as possible, we wanted to be cautious.
For instance, we paid close attention to the size of any changes we observed. In some cases, the figures were fairly similar between 2021 and 2023, and even without the mode shift, we wouldn’t make too much of them.
We gave a thorough look at more striking differences. For example, 21% of Americans said they used TikTok in our 2021 phone survey, and that’s risen to 33% now in our paper/online survey. Going back to our test runs from earlier years helped us conclude it’s unlikely this change was all due to mode. We believe it also reflects real change over time.
While the mode shift makes it trickier than usual to talk about trends, we believe the change in approach is a net positive for the quality of our work. NPORS sets us up well for the future.
How are you communicating this mode shift in your published work?
McClain: It’s important to us that readers can quickly and easily understand the shift and when it took place.
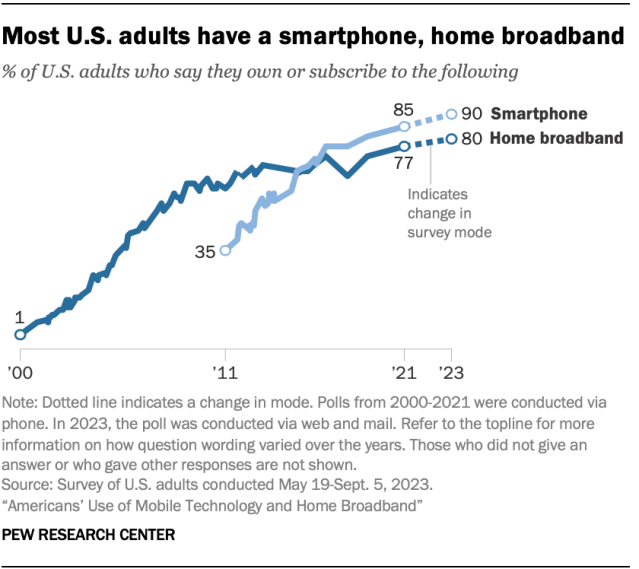
In some cases, we’ll be displaying the findings from our paper/online survey side by side with the data points from prior phone surveys. Trend charts in our reports signal the mode shift with a dotted line to draw attention to the change in approach. In our fact sheets, a vertical line conveys the same thing. In both cases, we also provide information in the footnotes below the chart itself.
In other places in our publications, we’re taking an even more cautious approach and focusing on the new data rather than on trends.
Did you have to change the way you asked survey questions?
McClain: Writing questions that keep up with the ever-changing nature of technology is always a challenge, and the mode shift complicated this further. For example, our previous phone surveys were conducted by interviewers, but taking surveys online or on paper doesn’t involve talking to someone. We needed to adapt our questions to keep the experience as consistent as possible on the new paper and online surveys.
Take who subscribes to home broadband, for example. Knowing we wouldn’t have an interviewer to probe and confirm someone’s response in the new modes, we tested out different options in advance to help us ensure we were collecting quality data.
In this case, we gave people a chance to say they were “not sure” or to write in a different type of internet connection, if the ones we offered didn’t quite fit their situation. We also updated the examples of internet connections in the question to be consistent with evolving technology.
Which findings from your latest survey stand out to you?
Anderson: There are several exciting things in our latest work, but two findings related to social media really stand out.
The first is the rise of TikTok. A third of U.S. adults – including about six-in-ten adults under 30 – use this video-based platform. These figures have significantly jumped since we last asked these questions in 2021. And separate surveys from the Center have found that TikTok is increasingly becoming a news source for Americans, especially young adults.
The second is how dominant Facebook remains. While its use has sharply declined among teens in the U.S., most adults – about two-thirds – say they use the site. And this share has remained relatively stable over the past decade or so. YouTube is the only platform we asked about in our current survey that is more widely used than Facebook.
These findings reinforce why consistently tracking the use of technology, especially specific sites and apps, is so important. The online landscape can evolve quickly. As researchers who study these platforms, a forward-looking mindset is key. We’ll continue looking for new and emerging platforms while tracking longer-standing sites to see how use changes – or doesn’t – over time.
To learn more about the National Public Opinion Reference Survey, read our NPORS fact sheet. For more on Americans’ use of technology, read our new reports:
