
To better understand Americans’ smartphone and broadband adoption, Pew Research Center surveyed 5,733 U.S. adults from May 19 to Sept. 5, 2023. Ipsos conducted this National Public Opinion Reference Survey (NPORS) for the Center using address-based sampling and a multimode protocol that included both web and mail. This way nearly all U.S. adults have a chance of selection. The survey is weighted to be representative of the U.S. adult population by gender, race and ethnicity, education and other categories.
Polls from 2000 to 2021 were conducted via phone. For more on this mode shift, please read our Q&A.
Here are the questions used for this analysis, along with responses, and its methodology.
In a far cry from the early 2000s, most U.S. adults today say they use the internet (95%), have a smartphone (90%) or subscribe to high-speed internet at home (80%), according to a Pew Research Center survey conducted May 19 to Sept. 5, 2023.
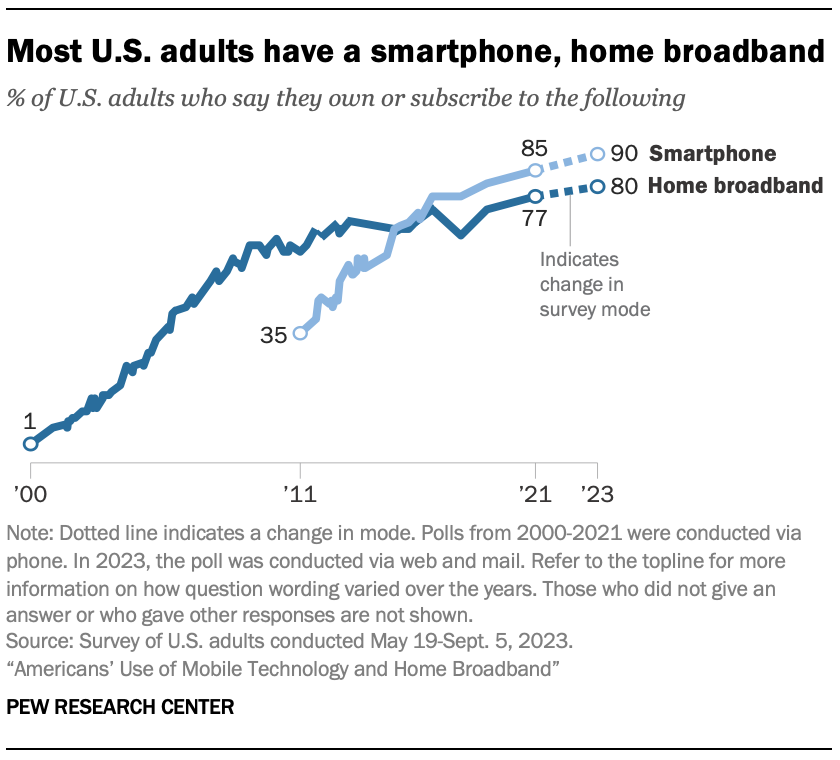
Though adoption of these technologies has surged over the past two decades, there are notable differences by age, household income and educational attainment.
The Center has been tracking technology use for many years. Recently, we shifted from gathering responses via telephone to the web and mail. Mode changes can affect study results in a number of ways, therefore, we have to take a cautious approach when examining how things have – or have not – changed since our last study on these topics in 2021. For more details on this shift, please read our Q&A.
Who has a smartphone and home broadband?
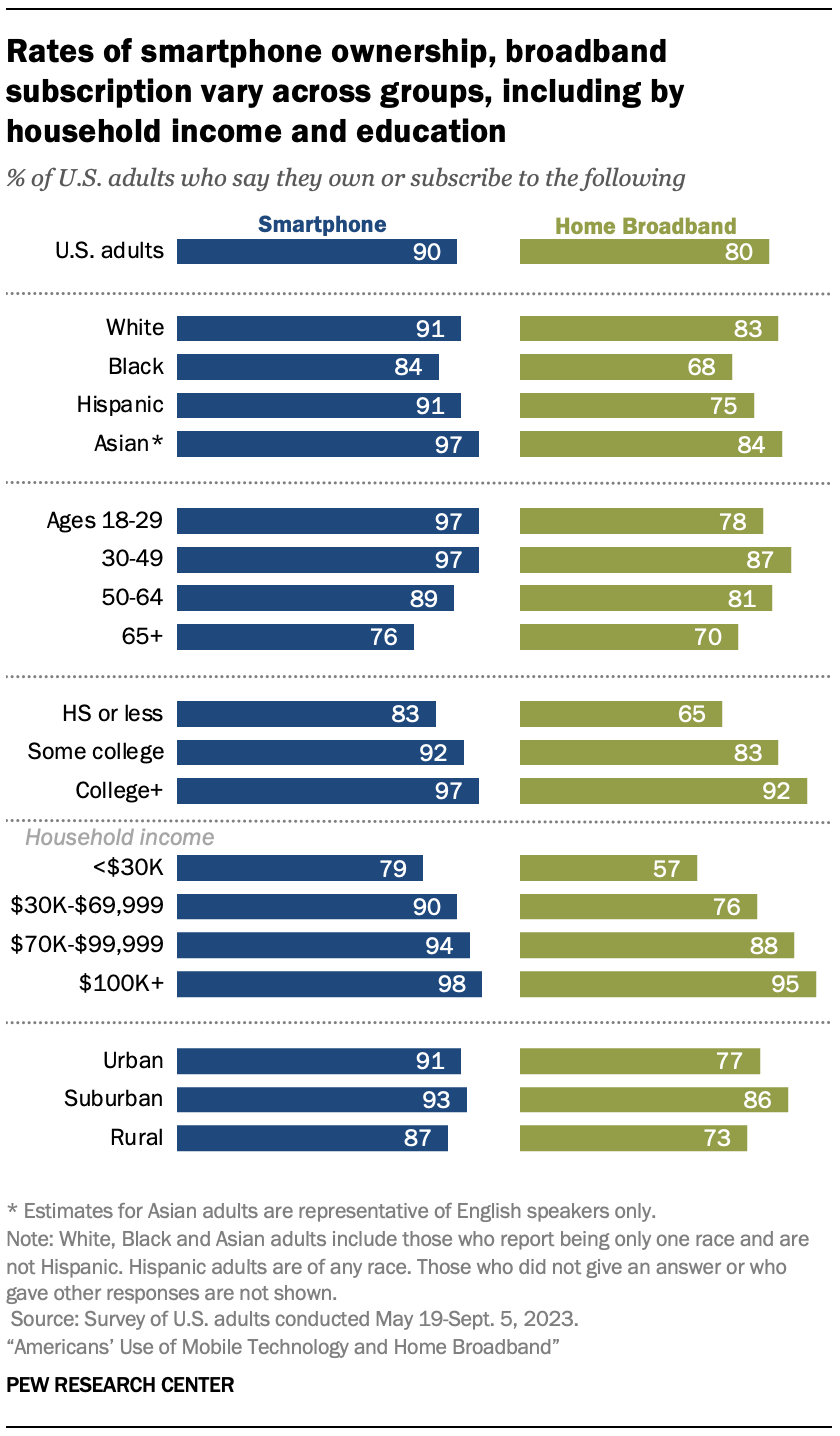
Even with high rates of adoption overall, divides exist by income, level of formal education and age. These differences are in line with the last time the Center asked about smartphone ownership and home broadband subscription in 2021.
Smartphone use
Smartphones are common across income levels, but those in households earning $100,000 or more annually are far more likely than those earning less than $30,000 per year to have one (98% vs. 79%).
There are also differences by education. Adults who have a bachelor’s degree or some college education own smartphones at higher rates than those with a high school diploma or less.
Age also plays a role: Adults 50 and older – especially those who are at least 65 – are less likely than their younger counterparts to own a smartphone.
Home broadband
There are large gaps between the lowest- and highest-income Americans in whether they have a broadband subscription. Nearly all (95%) adults with an annual household income of at least $100,000 say they have one. This compares with 57% of adults in households that make less than $30,000 per year. A similar pattern emerges by level of formal education.
While most adults living in rural areas (73%) subscribe to high-speed internet at home, they are less likely to do so than their peers living in suburban areas (86%) and slightly less likely than those living in urban settings (77%).
Asian (84%) and White (83%) adults are more likely than Hispanic (75%) or Black (68%) adults to say they subscribe to home broadband. Many of these differences between racial and ethnic groups fade, though, when accounting for income, education, age and community type.1
‘Smartphone-dependent’ adults
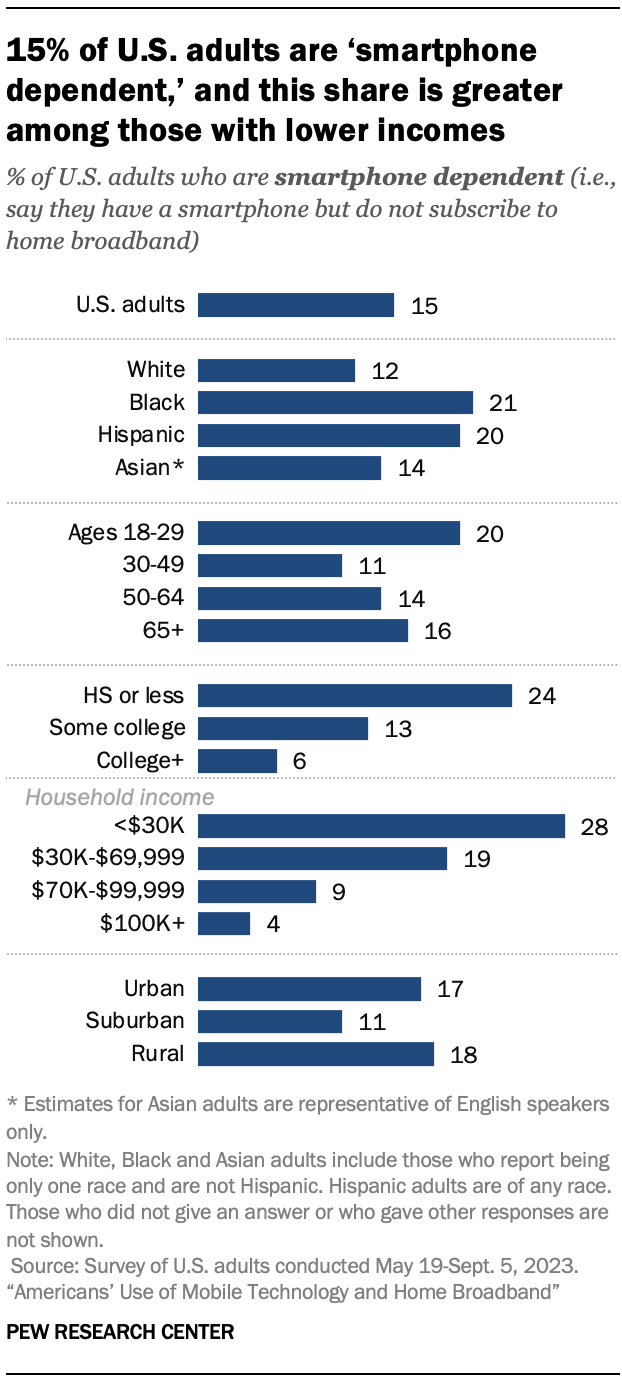
Some 15% of adults are “smartphone dependent,” meaning they own a smartphone but do not subscribe to a high-speed home broadband service. This share has remained relatively stable in recent years but is roughly double what we found in 2013 (8%).
Those who live in lower-income households are particularly likely to rely on their smartphone to go online. The shares who fall into this category are:
- 28% of Americans in households earning less than $30,000 per year
- 19% of Americans in households earning $30,000 to $69,999 per year
- 9% of Americans in households earning $70,000 to $99,999 per year
- 4% of Americans in households earning $100,000 or more per year
Adults with lower levels of formal education are also more likely to be smartphone dependent. About a quarter (24%) of those who have completed high school or less education rely on a mobile device for internet, compared with 6% of those with a college degree.
Roughly one-in-five Black or Hispanic adults are smartphone dependent, compared with a smaller share of White adults.
What share of Americans are constantly online?
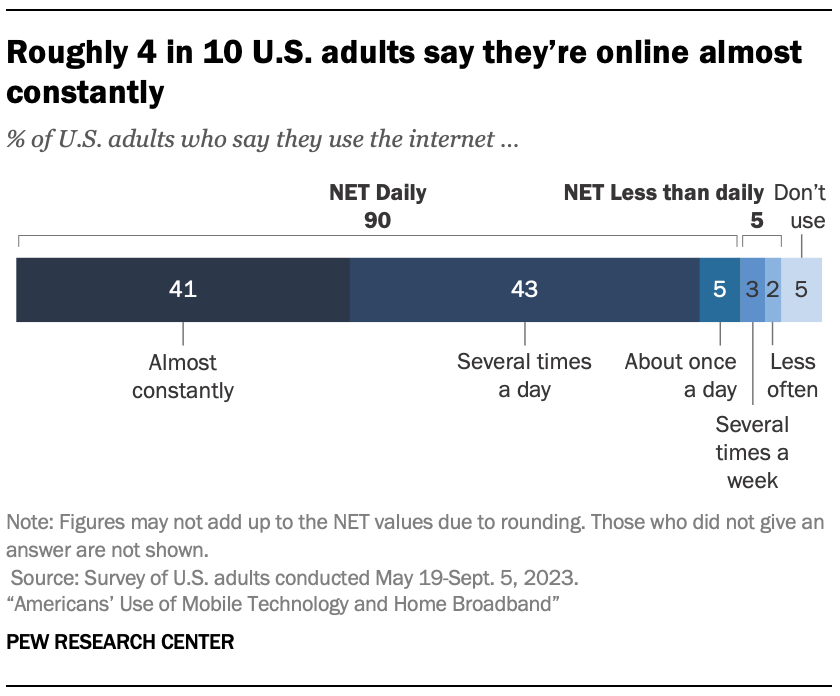
With the internet becoming more and more central to Americans’ daily lives, nine-in-ten U.S. adults now say they go online every day. This includes 41% who report using the internet almost constantly.
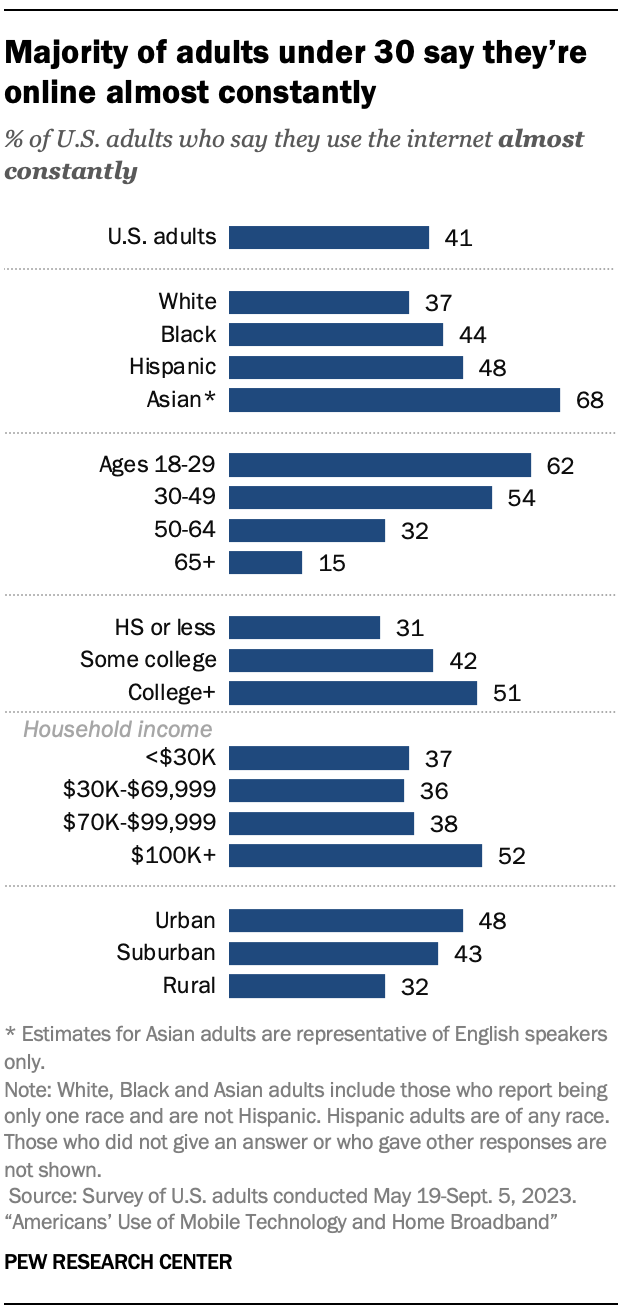
However, some are more likely to be constantly online than others – especially the youngest adults. About six-in-ten adults ages 18 to 29 (62%) say they are constantly online, compared with smaller shares of those in older age groups, including only 15% of those 65 and older.
Those with higher levels of education and household incomes are also more likely to say they are online almost constantly. For instance, roughly half (52%) of adults with an annual household income of at least $100,000 report using the internet almost constantly. This compares with about four-in-ten or fewer among those with an annual household income less than $100,000.
Differences also emerge by the type of community that adults live in. About half of those living in urban areas (48%) say they use the internet almost constantly, compared with 43% of those in suburban communities and 32% of those in rural settings.


