Summary
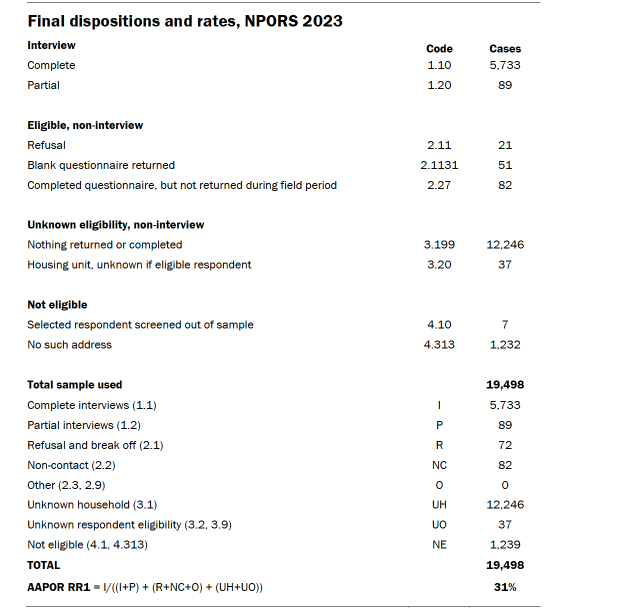
Ipsos conducted the National Public Opinion Reference Survey (NPORS) for Pew Research Center using address-based sampling and a multimode protocol. The survey was fielded from May 19 to Sept. 5, 2023. Participants were first mailed an invitation to complete an online survey. A paper survey was later mailed to those who did not respond. In total, 2,217 respondents completed the survey online, and 3,516 respondents completed the paper survey (total n=5,733). The survey was administered in English and Spanish. The AAPOR Response Rate 1 was 31%.
Sample definition
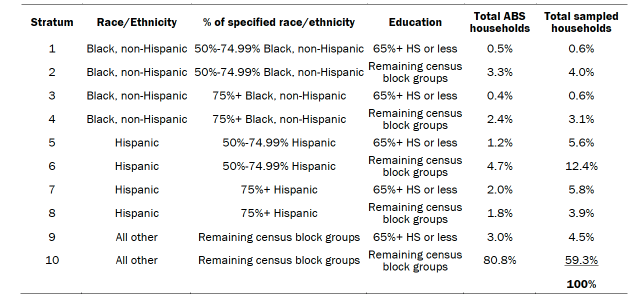
The sample was drawn from the U.S. Postal Service Computerized Delivery Sequence File and was provided by MSG (Marketing Systems Group). Occupied residential addresses (including “drop points”) in all U.S. states (including Alaska and Hawaii) and the District of Columbia had a nonzero chance of selection. The draw was a national, stratified random sample, with differential probabilities of selection across the mutually exclusive strata. Ipsos designed the sample plan as shown in the table below.
Mailing protocol
Ipsos sent initial mailings in a 9-by-12-inch envelope via first-class mail to the 19,498 sampled households. These packets included two $1 bills and a letter asking a member of the household to complete an online survey using the website and password provided. If two or more adults were in the household, the letter asked the adult with the next birthday to complete the survey. Sampled households were later sent a reminder postcard and then a reminder letter via first-class mail.
Ipsos sent nonresponding households with a deliverable address a 9-by-12-inch Priority Mail envelope. The Priority envelope contained a letter, a $5 bill, a paper version of the survey and a postage-paid return envelope. The paper survey was one 11-by-17-inch page folded booklet-style. The within-household selection instructions were identical to those used in the earlier online survey request. Nonresponding households were later sent a second envelope containing another copy of the paper questionnaire by first-class mail.
The initial mailing and the first mailing containing the paper version of the survey were each sent out in two separate launches: soft launch and full launch. The soft launch made up 5% of the sample at each point in the field period and was sent out several days earlier than the full launch. The full launch consisted of the remaining sample.
Households in Hispanic-dominant census block groups received all materials in English and Spanish. All other households received materials in English only. Those who completed the survey online or returned the completed paper survey were sent a $10 post-incentive.
Questionnaire development and testing
Pew Research Center developed the questionnaire in consultation with Ipsos. The online questionnaire was tested on both desktop and mobile devices. The test data was analyzed to ensure the logic and randomizations were working as intended before the survey was launched.
Weighting
The survey was weighted to support reliable inference from the sample to the target population of U.S. adults. The weight was created using a multistep process that includes a base weight adjusting for differential probabilities of selection and a raking calibration that aligns the survey with the population benchmarks. The process starts with the base weight, which accounted for the probability of selection of the address from the U.S. Postal Service Computerized Delivery Sequence File frame, as well as the number of adults living in the household.
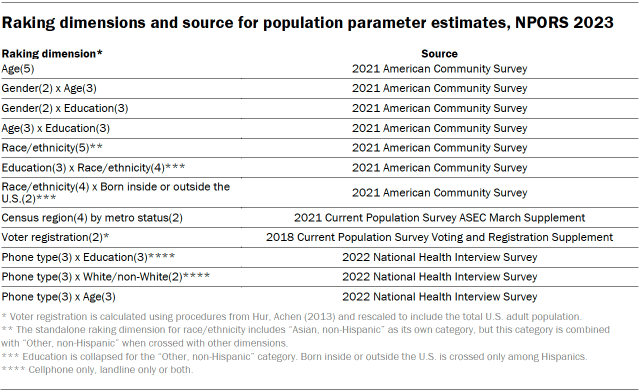
Then the base weights are calibrated to population benchmarks using raking, or iterative proportional fitting. The raking dimensions and the source for the population parameter estimates are reported in the table below. All raking targets are based on the noninstitutionalized U.S. adult population (ages 18 and older). These weights are trimmed at about the 1st and 99th percentiles to reduce the loss in precision stemming from variance in the weights.
Design effect and margin of error
Weighting and survey design features that depart from simple random sampling tend to result in an increase in the variance of survey estimates. This increase, known as the design effect, or “deff,” should be incorporated into the margin of error, standard errors and tests of statistical significance. The overall design effect for a survey is commonly approximated as 1 plus the squared coefficient of variation of the weights.
For this survey, the margin of error (half-width of the 95% confidence interval) incorporating the design effect for full sample estimates at 50% is plus or minus 1.8 percentage points. Estimates based on subgroups will have larger margins of error. It is important to remember that random sampling error is only one possible source of error in a survey estimate. Other sources, such as question wording and reporting inaccuracy, may contribute additional error.
A summary of the weights and their associated design effect is reported in the table below.

The following table shows the unweighted sample sizes and the error attributable to sampling that would be expected at the 95% level of confidence for different groups in the survey.
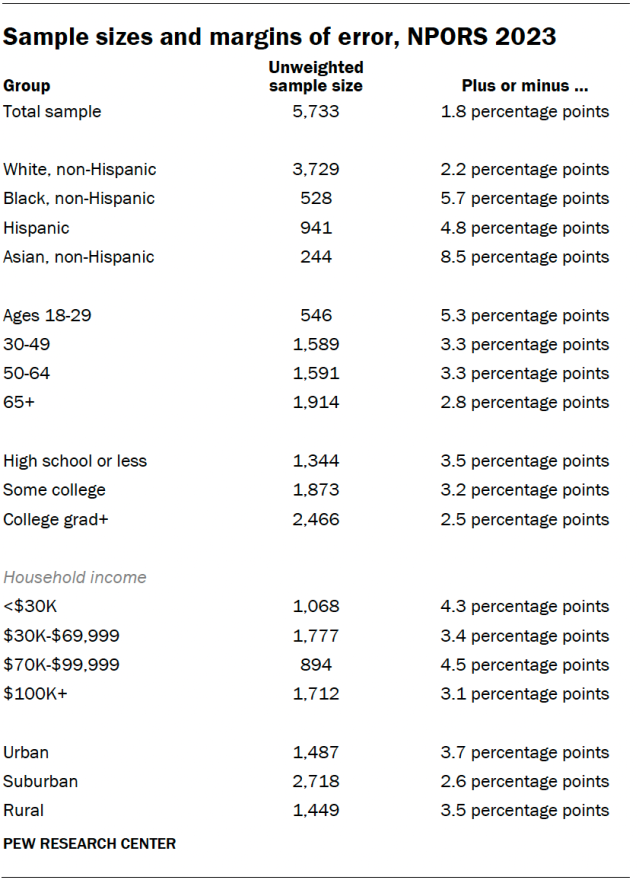
Sample sizes and sampling errors for other subgroups are available upon request. In addition to sampling error, one should bear in mind that question wording and practical difficulties in conducting surveys can introduce error or bias into the findings of opinion polls.
A note about the Asian adult sample
This survey includes a total sample size of 325 Asian adults. The sample primarily includes English-speaking Asian adults and, therefore, may not be representative of the overall Asian adult population. Despite this limitation, it is important to report the views of Asian adults on the topics in this study. As always, Asian adults’ responses are incorporated into the general population figures throughout this report.
Dispositions
The table below reports the disposition of all sampled households for the survey.