
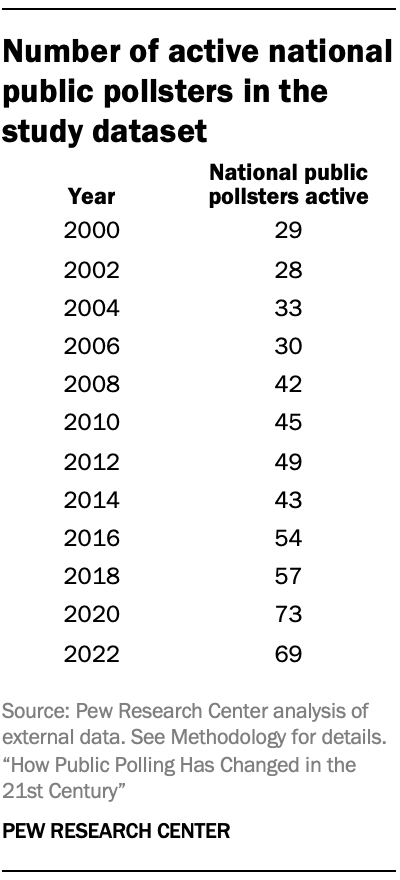
This study looks at how national public opinion polling in the United States changed from 2000 to 2022. It focuses on two aspects: the sample source(s) – that is, where the survey takers came from – and the mode(s), or how they were interviewed. The study tracks both the growth in the number of national pollsters and changes to how they conduct their public polls.
The unit of analysis is the polling organization. The dataset accompanying this report lists the 78 organizations included. The Documentation URLs file provides the webpages used to code the methods. The Codebook details what each code means. Center researchers compiled the poll information in several stages and using a variety of sources. The initial coding of sample source and mode of interview was based on information available from sources such as pollster websites, news articles, press releases and the Roper iPoll data archive. After compiling the data, Center staff attempted to contact each organization and ask them to confirm whether the information for that organization was accurate. Most organizations that responded confirmed that the information gathered was accurate. When organizations provided corrections or additions, staff updated the study database with that information. Each of these steps is described in greater detail in the Methodology.
Address-based sampling (ABS). ABS refers to recruiting survey takers by selecting a random sample of residential addresses from a master list, such as that maintained by the U.S. Postal Service.
Interactive voice response (IVR). IVR refers to a poll that entails automatic dialing of telephone numbers and a recorded voice asking a series of survey questions. They are sometimes referred to as “robo-polls.”
Mode of interview. This refers to the format in which respondents are presented with and respond to survey questions. Surveys can be administered by an interviewer, or they can be self-administered. The most common interviewer-administered mode in public polling is live telephone. The most common self-administered modes include online, text message and paper.
Method. This study uses the term “method” broadly, referring to the source of the respondents (the “sampling frame”) and how they were interviewed (the “mode”). This study describes a change in either of those as a change in method.
Multiple methods. Sometimes pollsters use multiple sample sources or multiple interview modes within a poll. Other times pollsters use multiple sample sources or multiple interview modes within the same year but in separate polls. The study describes any of the above as a pollster using multiple methods that year.
Survey panel. This is a group of people who have agreed to take surveys on an ongoing basis. The survey panels documented in this study each have thousands (and in some cases tens of thousands) of members.
Probability-based panel. This refers to a national survey panel recruited using random sampling from a database that includes most people in the population. Today, most such panels in the U.S. recruit by drawing random samples of residential addresses or telephone numbers. Typically, data collection with these panels is done online. However, some of these panels interview a small fraction of respondents (usually about 5% or fewer) using an offline mode such as live telephone. These panels are “probability-based” because the chance that each address or phone number was selected is known. However, the chance that each selected person will join the panel or take surveys after joining is not known.
Online opt-in polls. These polls are recruited using a variety of methods that are sometimes referred to as “convenience sampling.” Respondents are not selected randomly from the population but are recruited from a variety of online sources such as ads on social media or search engines, websites offering rewards in exchange for survey participation, or self-enrollment in an opt-in panel. Some opt-in samples are sourced from a panel (or multiple panels), while others rely on intercept techniques where respondents are invited to take a one-off survey.
Registration-based sampling. Some election polls sample from an official list of registered voters. All states are required to maintain a computerized and up-to-date list of voters and to make these lists publicly available for non-commercial purposes such as voter outreach and research.
Sampling frame. A sampling frame is a list of the population of interest. For a survey of the public, it is typically telephone numbers or residential addresses and ideally includes all members of the population (though in practice there are often gaps and omissions). The survey sample is selected from this list.
Sponsor. In this report, a survey sponsor is an organization that publicly releases results from a poll conducted on its behalf. Survey sponsors typically conceive of the study and either provide or obtain funding for it. Sponsors and vendors sometimes share the practical tasks involved in conducting a survey, such as when a sponsor drafts the questionnaire, and the vendor creates the sample and collects the data. This report uses “sponsor” and “pollster” interchangeably.
Text message polling. Text messaging is used by some organizations to contact a sample of cellphone numbers for the purpose of either directing respondents to an online survey or asking them a set of survey questions using a series of text messages and responses.
Vendor. In this report, the survey vendor is the organization that collects the survey data. The full set of tasks necessary for a survey are often shared between the sponsor and vendor, with the exact mix being determined by the specific expertise of the two parties and other factors. Sometimes vendors are also sponsors, either alone or in partnership with other sponsors.
The 2016 and 2020 presidential elections left many Americans wondering whether polling was broken and what, if anything, pollsters might do about it. A new Pew Research Center study finds that most national pollsters have changed their approach since 2016, and in some cases dramatically. Most (61%) of the pollsters who conducted and publicly released national surveys in both 2016 and 2022 used methods in 2022 that differed from what they used in 2016. The study also finds the use of multiple methods increasing. Last year 17% of national pollsters used at least three different methods to sample or interview people (sometimes in the same survey), up from 2% in 2016.
This study captures what changes were made and approximately when. While it does not capture why the changes were made, public commentary by pollsters suggests a mix of factors – with some adjusting their methods in response to the profession’s recent election-related errors and others reacting to separate industry trends. The cost and feasibility of various methods are likely to have influenced decisions.
This study represents a new effort to measure the nature and degree of change in how national public polls are conducted. Rather than leaning on anecdotal accounts, the study tracked the methods used by 78 organizations that sponsor national polls and publicly release the results. The organizations analyzed represent or collaborated with nearly all the country’s best-known national pollsters. In this study, “national poll” refers to a survey reporting on the views of U.S. adults, registered voters or likely voters. It is not restricted to election vote choice (or “horserace”) polling, as the public opinion field is much broader. The analysis stretches back to 2000, making it possible to distinguish between trends emerging before 2016 (e.g., migration to online methods) and those emerging more recently (e.g., reaching respondents by text message). Study details are provided in the Methodology. Other key findings from the study include:
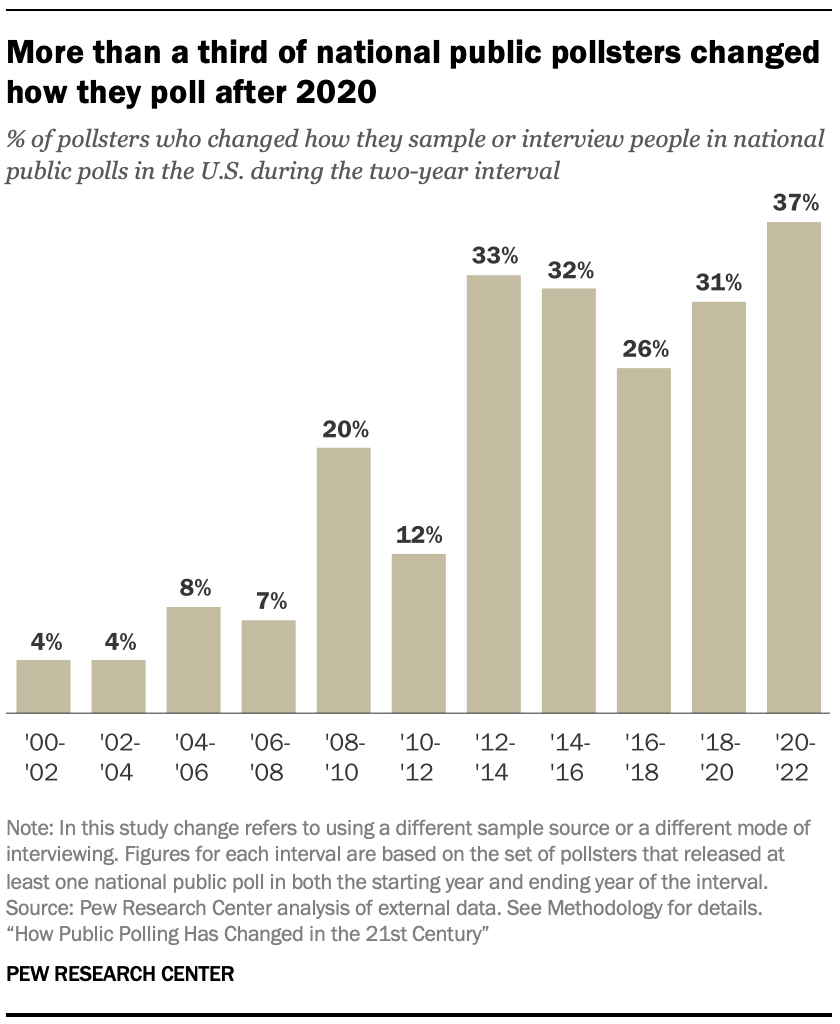
Pollsters made more design changes after 2020 than 2016. In the wake of the 2016 presidential election, it was unclear if the polling errors were an anomaly or the start of a longer-lasting problem. 2020 provided an answer, as most polls understated GOP support a second time. The study found that after 2020, more than a third of pollsters (37%) changed how they sample people, how they interview them, or both. This compares with about a quarter (26%) who made changes after 2016. As noted above, though, these changes did not necessarily occur because of concerns about election-related errors.
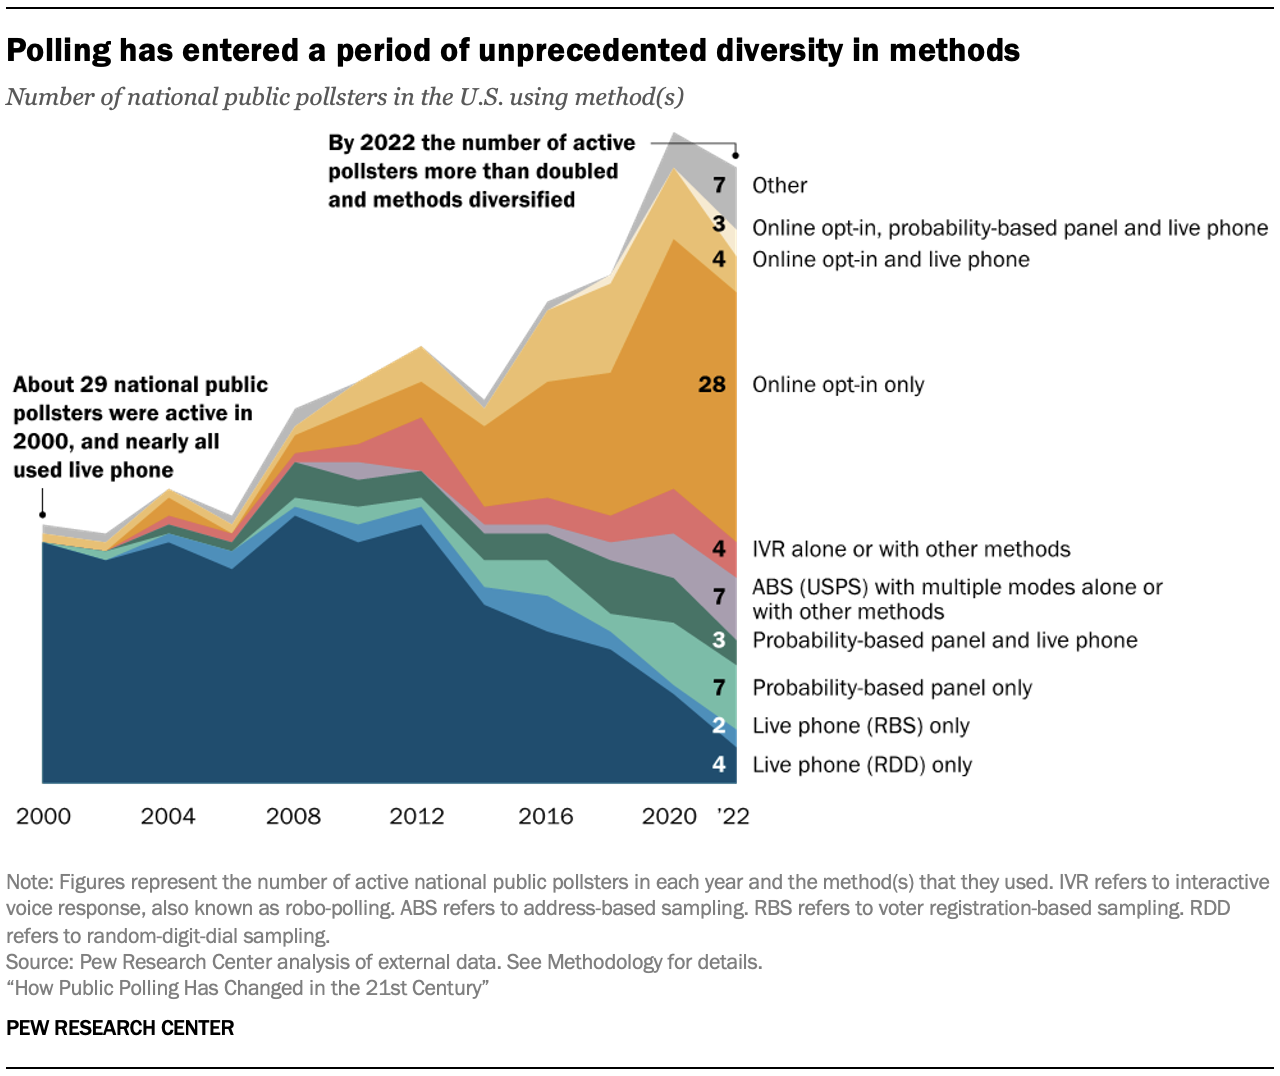
The number of national pollsters relying exclusively on live phone is declining rapidly. Telephone polling with live interviewers dominated the industry in the early 2000s, even as pollsters scrambled to adapt to the rapid growth of cellphone-only households. Since 2012, however, its use has fallen amid declining response rates and increasing costs. Today live phone is not completely dead, but pollsters who use it tend to use other methods as well. Last year 10% of the pollsters examined in the study used live phone as their only method of national public polling, but 32% used live phone alone or in combination with other methods. In some cases, the other methods were used alongside live phone in a single poll, and in other cases the pollster did one poll using live phone and other polls with a different method.
Several key trends, such as growth of online polling, were well underway prior to 2016. While the 2016 and 2020 elections were consequential events for polling, the study illustrates how some of the methodological churn in recent years reflects longer-term trends. For example, the growth of online methods was well underway before 2016. Similarly, some live phone pollsters had already started to sample from registered voter files (instead of RDD, random-digit dialing) prior to 2016.
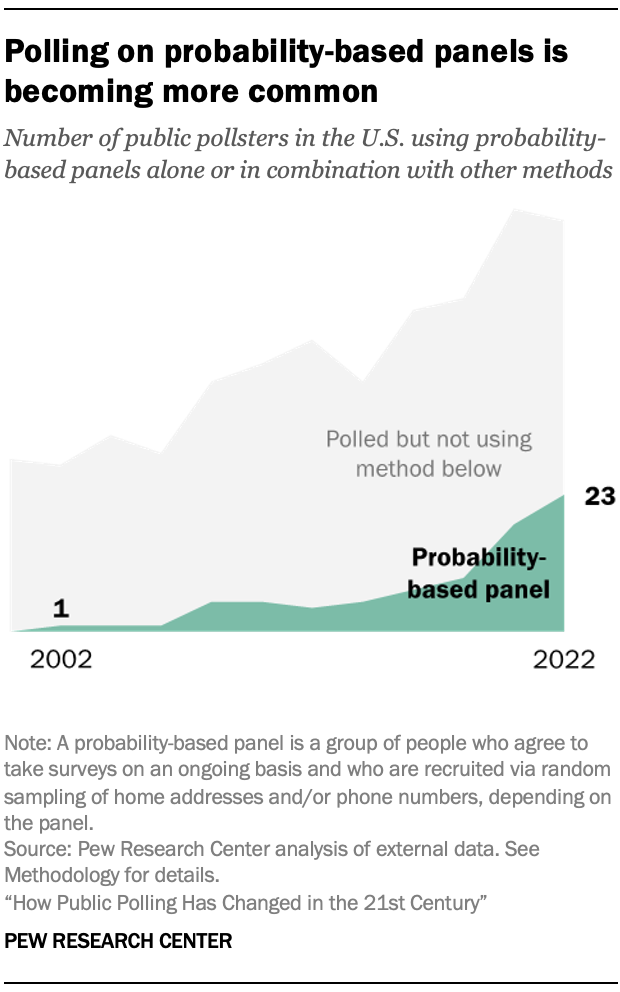
Use of probability-based panels has become more prevalent. A growing number of pollsters have turned to sampling from a list of residential addresses from the U.S. Postal Service database to draw a random sample of Americans, a method known as address-based sampling (ABS). There are two main types of surveys that do this: one-off or standalone polls and polls using survey panels recruited using ABS or telephone (known as probability-based panels). Both are experiencing growth. The number of national pollsters using probability-based panels alone or in combination with other methods tripled from 2016 to 2022 (from seven to 23). The number of national pollsters conducting one-off ABS surveys alone or in combination with other methods during that time rose as well (from one in 2016 to seven in 2022).
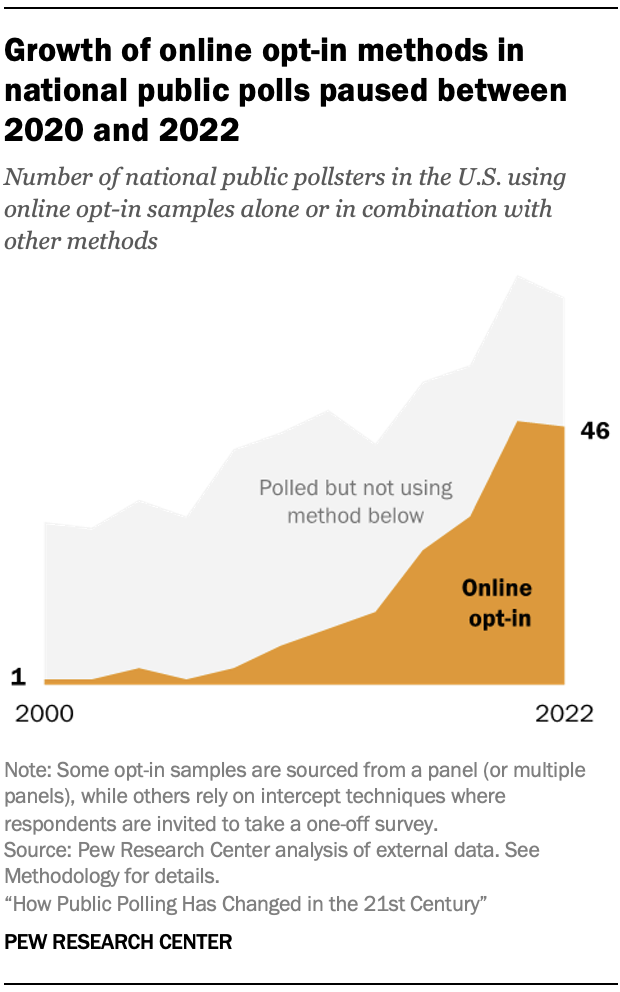
The growth of online opt-in among national pollsters appears to have paused after 2020. The number of national pollsters using convenience samples of people online (“opt-in sampling”) – whether alone or in combination with other methods – more than quadrupled between 2012 and 2020 (from 10 to 47). In 2022, however, this number held flat, suggesting that the era of explosive growth could be ending.
Whether changes to sample sources and modes translate into greater accuracy in presidential elections remains to be seen. The fact that pollsters are expanding into new and different methods is not a guarantee that the underrepresentation of GOP support occurring in 2016 and 2020 preelection polls has been fixed. Polling accuracy improved in 2022, but this represents only one nonpresidential election.
Notable study limitations
A study of this nature requires difficult decisions about what exactly will be measured and what will not. This study focuses on two key poll features: the sample source(s) – that is, where the respondents came from – and the mode(s), or how they were interviewed. While important, these elements are not exhaustive of the decisions required in designing a poll. The study did not attempt to track other details, such as weighting, where public documentation is often missing. Because the study only measured two out of all possible poll features, estimates from this study likely represent a lower bound of the total amount of change in the polling industry.
Another limitation worth highlighting is the fact that state-level polls are not included. Unfortunately, attempting to find, document and code polling from all 50 states and the District of Columbia would have exceeded the time and staff resources available. A related consideration is that disclosure of methods information tends to be spottier for pollsters who exclusively work at the state level, though there are some exceptions. It is not clear whether analysis at the level of detail presented in this report would be possible for state-only pollsters.
While not necessarily a limitation, the decision to use the polling organization rather than individual polls as the unit of analysis has implications for the findings. The proliferation of organizations using online methods implies but does not prove that online polls grew as well. However, research conducted by the American Association for Public Opinion Research (AAPOR) following the 2016 and 2020 elections reveals an explosion in the share of all polling done using online methods. AAPOR estimated that 56% of national polls conducted shortly before the 2016 election used online methods; the comparable share for 2020 was 84%. More details on the strengths and weaknesses of the study are presented in the Methodology.
Changes in methods are driven by many considerations, including costs and quality
In an attempt to verify the accuracy of the categorization of polling methodologies, researchers attempted to contact all organizations represented in the database. Several pollsters contacted for this study noted that use of a particular method was not necessarily an endorsement of methodological quality or superiority. Instead, design decisions often reflect a multitude of factors. Survey cost – especially the increasing cost of live phone polling – came up repeatedly. Timing can also be a factor, as a design like address-based sampling can take weeks or even months to field. As noted above, this study does not attempt to address why each organization polled the way they did. It aims only to describe major changes observable within the polling industry. Nor does it evaluate the quality of different methods, as a multitude of other studies address that question.
Changes to polling after 2020 differed from those after 2016
The study found a different kind of change within the polling industry after 2020 versus 2016. After 2020, changes were both more common and more complex. More than a third (37%) of pollsters releasing national public polls in both 2020 and 2022 changed their methods during that interval. By contrast, the share changing their methods between 2016 and 2018 was 26%.
The nature of the changes also differed. About half of the changes observed from 2016 to 2018 reflected pollsters going online – either by adding online interviewing as one of their methods or fully replacing live phone interviewing. By contrast, the changes observed from 2020 to 2022 were more of a mix. During that period, some added an approach like text messaging (e.g., Change Research, Data for Progress), probability-based panels (Politico, USA Today) or multiple new methods (CNN, Wall Street Journal). About a quarter of the change observed from 2020 to 2022 reflected pollsters who had already moved online dropping live phone as one of their tools (e.g., CBS News, Pew Research Center).
A look at change over the entire recent period – from 2016 to 2022 – finds that more than half of national public pollsters (61%) used methods in 2022 that differed from those they used in 2016. As noted above, if features like weighting protocols were included in the analysis, that rate would be even higher.
A longer view of modern public polling (going back to 2000) shows that methodological churn began in earnest around 2012 to 2014. That was a period when about a third of national pollsters changed their methods. Change during that period was marked by pollsters starting to migrate away from live telephone surveys and toward online surveys.
Pollsters increasingly use multiple methods – sometimes three or more
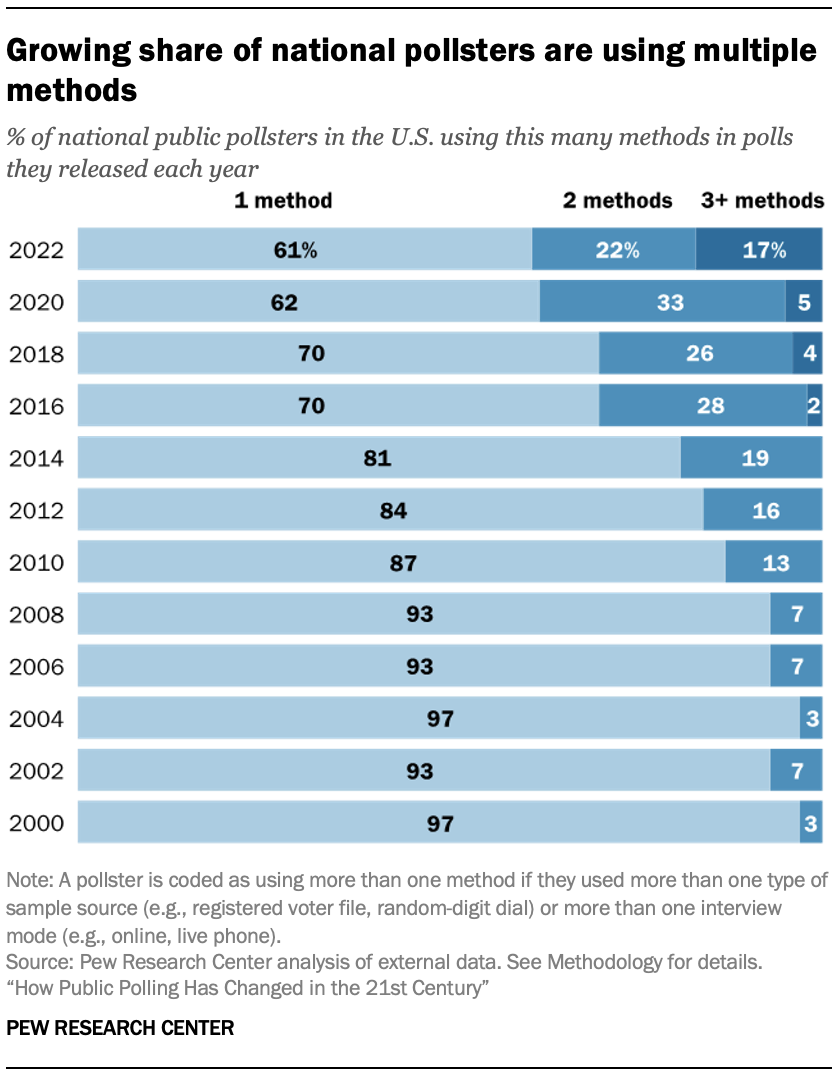
Pollsters are not just using different methods, many are now using multiple methods, the study found. Here again there is a discernable difference in how polls changed after 2016 and how they changed after 2020. After 2016, the share of pollsters using multiple methods remained virtually unchanged (30% in both 2016 and 2018). After 2020, however, the share climbed to 39%. Notably, the share of pollsters using three or more different methodologies in their national public polls tripled from 5% in 2020 to 17% in 2022.
In this analysis, “multiple methods” refers to use of multiple sample sources (e.g., registered voter files and random-digit dial) or multiple interview modes (e.g., online, mail, live telephone). In some cases, several methods were used in a single poll. In other cases the pollster did one poll using one method and another poll using another method.
As an example, in 2014 Pew Research Center switched from exclusively using live phone with random-digit-dial sample to also using a probability-based panel. In 2020 the Center added an additional method, one-off address-based sample surveys offering online or mail response. By 2022, the Center dropped live phone polling. Pollsters that used at least three different methods in 2022 include CNN, Gallup, NPR, Politico and USA Today.
Text messaging and address-recruited panels see growth after 2020
An overarching theme in the study is the growth of new methods. Analysis earlier in this report aimed to describe trends for the most prominent methods. In the past, pollsters often used just one method (e.g., live phone with random-digit dial). That has changed. Today pollsters tend to use new methods (such as text) as one of several ways that they reach people. To track the trajectory of these newer methods, it helps to consider the number of pollsters using the method by itself or in combination with other methods.
A prime example is text message polling. An extremely small share of pollsters conduct national public polls exclusively by text. A larger share use text alongside another method, such as online opt-in.
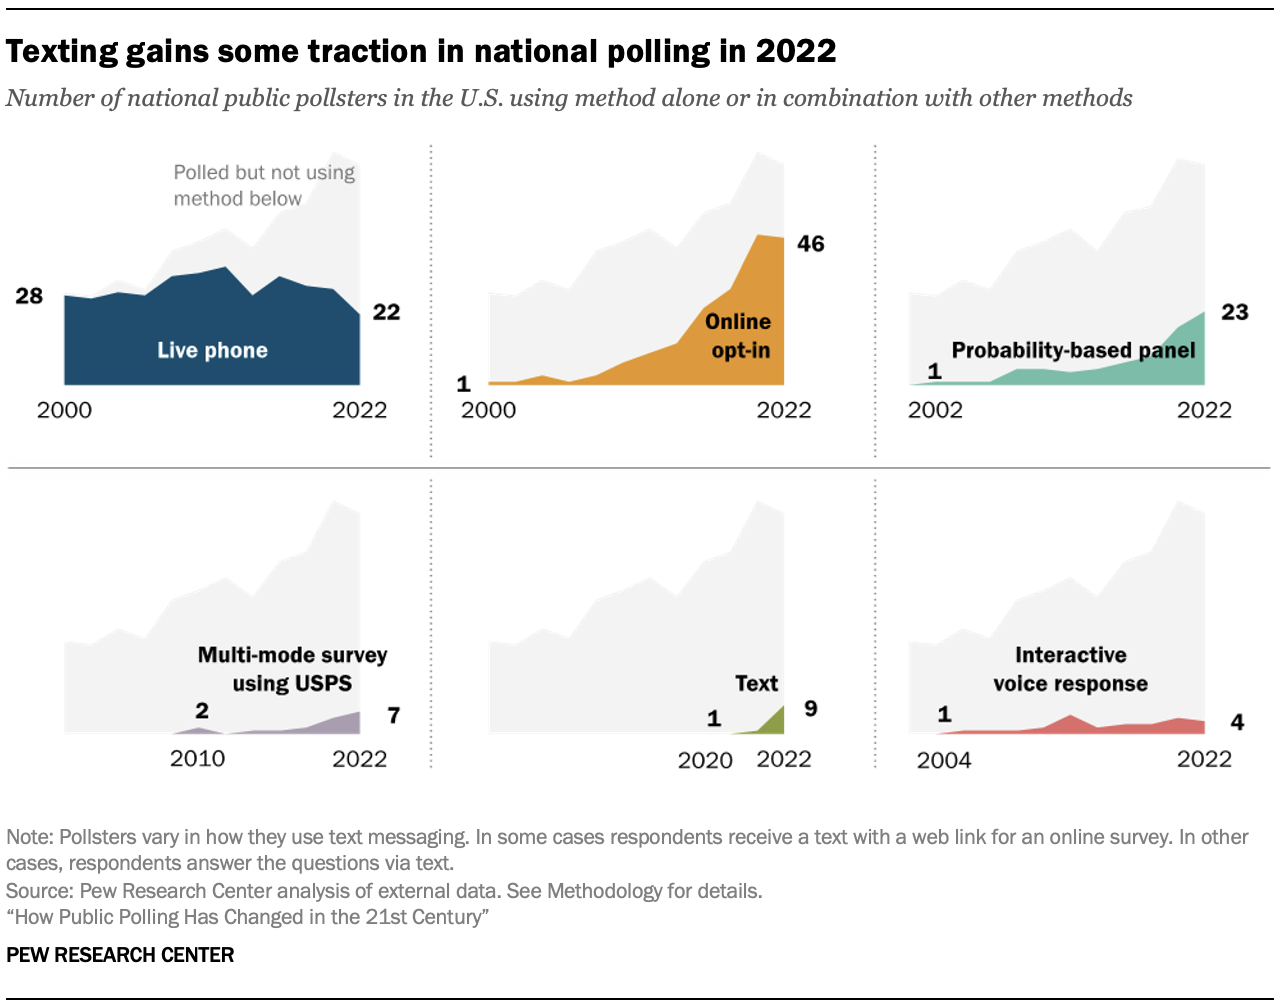
How texting is used varies. In some cases respondents receive a text with a web link for an online survey. In other cases, respondents answer the questions via text. Among the pollsters in this study, just one used texting in a national public survey in 2020. In 2022 that number rose to nine, representing 13% of the active national pollsters tracked that year. These figures reflect the number of pollsters using texting alone or in combination with other methods like live phone.
Analysis looking at methods used either alone or in combination with other approaches also suggests a change in the trajectory of online opt-in polling. While online opt-in usage grew tremendously between 2006 and 2020, that growth appears to have slowed if not stopped in 2022 for national polling.
By contrast, the share of national pollsters turning to probability-based panels continues to grow. In 2022 a third (33%) of national pollsters used probability-based panels either alone or in combination with other methods. This is up from roughly 10% during most of the 2010s.
Live phone was once the dominant method of polling but has been in decline since 2016. As of 2022, about a third of national pollsters used live phone alone or in combination (32%), while a much smaller share relied on it as their only method (10%).
The study also tracked the adoption of a specific kind of opt-in sample – members of an online opt-in panel who are matched to a record in a national registered voter file. This study first observed that approach in 2018. In 2018, 2020 and 2022, about 3% to 5% of national public pollsters used online opt-in samples matched to registered voter files, the study found.


