
Survey researchers increasingly recognize that a single survey of the general public can rarely represent the views of small groups of Americans. Such surveys frequently have too few interviews with certain populations – such as smaller religious or racial or ethnic groups – for those voices to be heard. For example, a nationally representative sample of 1,000 Americans wouldn’t include enough people to support reliable estimates for many small groups, such as Muslims or Korean Americans.
One way to address this limitation is to field a survey specifically of a subpopulation. In 2022 and 2023, for instance, Pew Research Center fielded a survey of more than 7,000 Asian Americans. In prior years, the Center conducted surveys of Jewish Americans, Muslim Americans and other populations.
Modern survey tools offer several ways to survey small populations, and in this explainer, we discuss the strengths and weaknesses of prominent approaches.
This Pew Research Center explainer provides an overview of different methods of surveying small populations in the United States. The data is drawn from a variety of sources. Findings about the difference between random and list samples among U.S. Muslims are from a Pew Research Center survey of Muslims conducted Jan. 23 to May 2, 2017. Findings about the difference between random and list samples among Asian Americans are from a Center survey of Asian Americans conducted July 5, 2022, to Jan. 27, 2023.
Findings about the difference between opt-in and random samples, compared with national benchmarks, are from a Pew Research Center study conducted June 11 to July 21, 2021, in which a common questionnaire containing 28 population benchmarks was administered to three samples from online, opt-in sample vendors and three from online panels that use address-based sampling (ABS) for recruitment, including a subsample of respondents from Wave 91 of the Center’s American Trends Panel. Each sample had between 4,912 and 5,147 respondents for a combined sample size of 29,937 in total. The composition of the opt-in samples was fixed to quotas for age by sex, race and Hispanic ethnicity and education based on the 2019 American Community Survey. All six samples were then weighted to align with the same population benchmarks as the full Wave 91 sample. In this analysis, we examine the 25 measures for which benchmarks are available for demographic subgroups.
Common methods of surveying small groups
Essentially, all surveys of small populations must grapple with the fact that achieving a sample large enough to produce meaningful findings is difficult and potentially very expensive. The most popular approaches for addressing this challenge include:
- Random sampling with extra effort in neighborhoods where members of the small population are most likely to live
- Commercial lists (or “flags”) of people likely to belong to the small population based on their name and/or their household’s consumer history
- Opt-in sampling, where respondents are not selected randomly from the population but are recruited because of their eligibility, often from online sources
- Organization lists, such as members of church congregations or community groups
- Network sampling, such as “snowball” or respondent-driven sampling, where respondents who qualify for a survey are asked to refer other people they personally know who would qualify for the survey
- Blended samples, which use some combination of the approaches above.
Each approach has strengths and weaknesses. But random sampling tends to provide the most rigorous and representative data. This is because nearly all members of the small population have a chance of being interviewed. Unlike lists or opt-in samples, random sampling does not require people to have certain potentially biasing characteristics, such as an “ethnic-sounding” last name, a digital paper trail of credit card purchases or ties to the community being studied. But random sampling is by far the most expensive approach.
Some studies of small populations instead rely exclusively on lists, opt-in samples or snowball sampling. These less expensive samples can provide a useful window into some small populations. Indeed, for many researchers, random sampling is not feasible and so their work must either use these other methods or not be conducted at all. In many cases, that would result in the loss of important knowledge about populations that are typically under-researched. But there are important data quality trade-offs that consumers of these polls should bear in mind. Depending on the research aim, some approaches are more “fit for use” than others.
Random sampling
Surveys are built around the idea that a relatively small number of people can represent the views of a large group. This idea is strongly supported by mathematical theory, as long as two things are true:
- First, everyone in the larger group must have a known chance of being included in the smaller group.
- Second, the people in the smaller group must be chosen at random. We encounter a similar idea in daily life. When making a pot of soup, for example, you can taste just a spoonful and have a pretty good idea of what the whole pot tastes like. Stirring the soup ensures that your spoonful of soup is a random sample of the whole pot.
For many decades, surveys of American adults started with a list of all home addresses or a list of all working phone numbers in the United States, and then drew random samples. In recent years, however, the costs of this type of survey have grown rapidly.
Applying this kind of traditional approach to small populations is even more expensive. With this approach, a survey focused on a specific group, such as Asian Americans, LGBTQ adults or Muslims, often requires two steps. First, a random set of addresses is selected. All of those people are given a short screening interview to find out if they are part of the group being studied. Then, the people who say they are part of the group are asked to take a survey focused on them.
The smaller the group is, the more screening interviews will be necessary to identify members of the group. For example, if the group being studied represents half the overall population of the U.S., about 100 people sampled at random would need to be screened to achieve 50 interviews with individuals from the group of interest. But if the group being studied represents only 1% of the U.S. population, screening a random sample of 100 people might only identify one member of the group being studied. On top of that, not everyone who is invited to take a survey actually responds to it, so the number of addresses or phone numbers needed to identify a single member of the group grows even larger, as do data collection costs.
Typically, researchers who use random sampling to survey small populations design their sampling in a certain way to make the effort more efficient. First, they consider where members of the small population are more or less likely to live. Asian Americans live across the U.S., but there are some neighborhoods, especially in states like California or New York, where their numbers are particularly high as a proportion of the entire community.
Researchers would typically sample addresses or phone numbers in these neighborhoods at a higher rate than in other areas. Members of the small population living in other parts of the country still get interviewed, just at a lower rate. After the survey, researchers adjust for this geographic imbalance by weighting. This ensures that the sample of respondents in the survey – including where they live and their demographic characteristics – resembles that of the entire population being studied. In the survey research field, this approach is known as a stratified random sample with differential probabilities of selection. Its strengths are inclusivity and representation. Its downside is cost.
Commercial lists
Lists based on ethnic-sounding names and/or a household’s consumer history offer a cost-efficient way to interview a small population. The downside of these lists (or “flags” as they’re sometimes known) is that they capture only a segment of the small population in question. Moreover, the segment they capture often differs from the full population, and sometimes these differences are important.
For example, in 2017, Pew Research Center surveyed about 1,000 Muslim Americans, roughly half of whom were reached via random sampling of residential landline and personal cellphone numbers, and half of whom were reached via a commercial list.
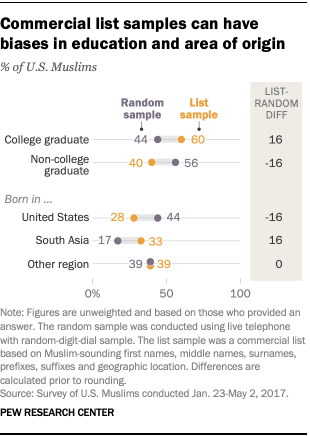
The interviews from the list contained clear biases. The list significantly overrepresented Muslims who were born in South Asia and those who graduated from college. The random sample, by contrast, included far fewer South Asians and showed that a majority of Muslim Americans – like most U.S. adults in general – are not college graduates.
In that 2017 study, researchers integrated the list into the overall stratified random sample to address these problems. But for surveys that only interview from lists, it can be much more difficult to correct for such imbalances through weighting.
Another example comes from the Center’s 2022-2023 survey of Asian Americans, which not only sought to interview Asians in the U.S., but also sought to obtain representative samples of the largest Asian origin subgroups in the U.S., such as Chinese, Filipino and Korean Americans.
In that survey, researchers drew a random sample from home addresses and used a listed sample of Asian Americans. There were separate lists for those with Chinese, Indian, Filipino, Vietnamese and Korean surnames.
Unfortunately, these lists do not perfectly cover the full spectrum of Asians living in the U.S. One reason is that having an identifiably ethnic surname is linked to immigration and acculturation: It’s not uncommon to change an ethnic surname to an Anglicized version upon immigrating to the U.S. (particularly among those who arrived in the 19th and 20th centuries), or to change a surname upon marrying someone of a different ethnicity. For certain research purposes, this may actually be helpful – for example, if your ideal sample is recent immigrants. But for a survey attempting to represent the entire Asian American population – and particularly a survey focused on issues of identity – this is a serious flaw.
These lists are also less reliable for younger and poorer people, for a couple of reasons. First, these groups tend to move frequently, so the addresses that appear on the list may be outdated. Second, these lists are based primarily on data from consumer credit bureaus and records of credit card transactions. Lower-income and younger adults are less likely to have established credit and therefore to appear on these lists.
In the Center’s recent survey, the respondents recruited from these surname lists don’t accurately represent the overall U.S. Asian population when compared with a reliable benchmark – in this case, the Census Bureau’s American Community Survey. For example, 24% of participants from the surname lists were born in the U.S., while in the overall Asian American population, 30% were born in the U.S. This means that the list sample underrepresents U.S.-born Asians by about 7 percentage points.
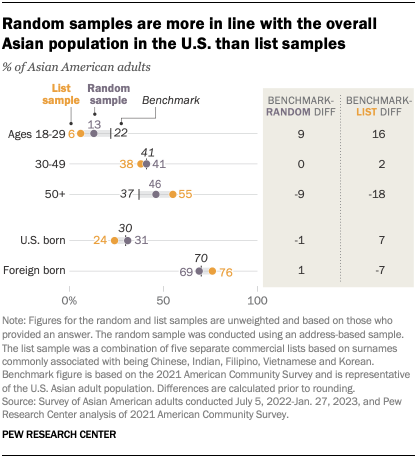
By contrast, 31% of the survey respondents who were recruited via random sampling are U.S. born, almost exactly the same as the share of the overall U.S. Asian adult population. (All figures from the list and random samples are unweighted.)
When it comes to age, both the list and random samples underrepresent younger adults and overrepresent older adults. But the random sample comes closer to the true age distribution of the nation’s Asian population. The list sample underrepresents those ages 18 to 29 by about 16 percentage points, while the random sample underrepresents this group by 9 points. The list sample overrepresents those 50 and older by 18 points, while the random sample does so by 9 points.
Online opt-in samples
Online opt-in surveys are those where respondents are not selected randomly but are recruited from a variety of sources, including through ads on social media or search engines; websites offering rewards in exchange for survey participation; or self-enrollment in an opt-in panel. Researchers then have the option to accept or reject volunteers in a way that brings the sample closer to the overall population on some key demographic variables, like age, race and ethnicity, and education.
The advantages of online opt-in sample are speed and cost. With opt-in samples, researchers can survey thousands of people quickly and cheaply and, in turn, find members of some small populations. As with lists, though, opt-in samples tend to cover only a segment of a small population. Specifically, they tend to only capture people who are frequently online and speak English.
Another weakness in online opt-in samples is the risk of bogus respondents. For example, one research team trying to survey a small population (Army veterans) found that over 80% of their opt-in respondents misrepresented their credentials to qualify for the survey and earn compensation. Pew Research Center also has found a high share of bogus respondents in opt-in surveys, who tend to answer “agree” or “approve” to any survey question, including answering yes to being Hispanic even when they very likely are not.
Many researchers have compared data quality from random sampling versus online opt-in sampling. The majority of those studies have found that online opt-in samples yield less accurate data.
In 2021, Pew Research Center conducted an experiment in which we looked at three different random samples (all of which were recruited by mail) and three different opt-in samples. We compared survey results from these samples to gold-standard benchmarks, most of which are drawn from large-scale, probability-based government surveys such as the American Community Survey and the Current Population Survey. (While these benchmarks aren’t infallible, they are generally seen as the most reliable sources of information on certain measures.)
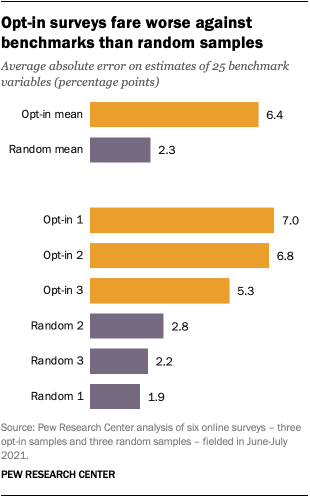
The least accurate survey was one of the opt-in samples. Across the 25 variables we examined, it differed from the benchmark by an average of 7.0 percentage points. The most accurate, in turn, was one of the surveys that recruited a random selection of participants based on their home addresses, differing from the benchmarks by an average of 1.9 points. Looking across all the opt-in samples, the average error was 6.4 percentage points, compared with 2.3 points for the average random sample.
The results were even more stark when looking specifically at Hispanics. Estimates for Hispanic adults differed from benchmarks by 10.9 percentage points, on average, when based on opt-in samples, compared with an average of 3.7 points when based on panels recruited with random sampling.
There are likely many factors that contribute to the larger errors for opt-in samples. The kinds of people available for online opt-in recruitment may be systematically different from the rest of the population in ways that are hard to detect or adjust for. It is also the case that bots or other disingenuous survey takers are more prevalent on opt-in surveys than in surveys recruited by probability-based means. This means that a certain share of responses are more or less random, not true views and experiences, lowering the data quality.
Organization lists
Imagine you are a researcher who wants to find out what share of Americans attend religious services regularly. Maybe you don’t have the funds to hire a survey firm to conduct a poll using a gold-standard method, such as a randomly dialed telephone survey or an online panel of respondents who were recruited by physical mailers sent to a random sample of addresses. Instead, you decide to do the data collection yourself or with a few assistants. You’re able to obtain a list of all the members of a few local churches. Your researchers call some of the people who appear on that list and ask how often they attend church.
By surveying only people who are members of a church, you’re going to get a vast overestimate of the percentage of people who regularly attend religious services. This is because you’re not surveying any of the many Americans who are not members of a church – people who almost certainly attend religious services less often than members. To be able to estimate the share of all Americans who attend religious services, you need a representative sample of all Americans.
The same problem appears in related contexts. For example, if you were to conduct the same experiment on your sample of church members, but ask about their views on abortion – rather than their church attendance – you would again come out with highly biased estimates. That’s because views on abortion are strongly linked to religion. And depending on the stance of the church whose members you are interviewing, you will likely find that your respondents tend toward the church’s stance, rather than the diversity of views held by the general public.
Church members also differ from non-church members in other ways: They are more likely to be older, to identify as or lean Republican and to believe in God, characteristics that may influence their views on a wide range of issues.
Network sampling
Other methods for surveying small populations are snowball sampling or respondent-driven sampling. In these approaches, respondents are selected from a social network of existing members of the sample. Researchers provide incentives for participation and for participants to recruit others.
These methods are popular because they are relatively efficient and low cost when compared with random sampling. The downsides, however, are the risk of bias and sometimes logistical challenges in achieving the desired sample size.
Some researchers have observed biases with samples created from these approaches. Notably, people who are a part of the group being studied – but who have limited or no ties to others in that group – are more likely to be left out of the sample. This means, for example, that we would underrepresent Asian Americans who have few or no Asian friends – a group that may have views that differ considerably from those who do have Asian friends.
Blended samples
Some studies use a combination of approaches. This lets researchers take advantage of the efficiency and cost savings of some of methods while still using more rigorous methods to recruit part of the sample.
List samples, for instance, can be effectively combined with address-based random samples. A list of registered voters can represent the views of Americans who are registered to vote. But it still can’t represent the views of people who aren’t on the list, so an additional source would be needed to recruit those who aren’t registered. Since most Americans are registered to vote, using a list can make the survey more efficient (and cheaper) than it would be using only a nationally representative sample, while still retaining the accuracy of a nationally representative sample.
Rigorous studies have shown that this approach works. We have used this approach in many Pew Research Center surveys, including our recent survey of Asian Americans and our earlier survey of U.S. Muslims.
