
In the United States and many other countries around the world, young adults tend to be less religious than older adults, at least by conventional measures such as whether they believe in God and how often they attend worship services.
Jewish Americans, who make up 2.4% of the U.S. adult population, are an exception: The youngest Jewish adults are just as religious as the oldest on some of these measures, according to a recent Pew Research Center survey.
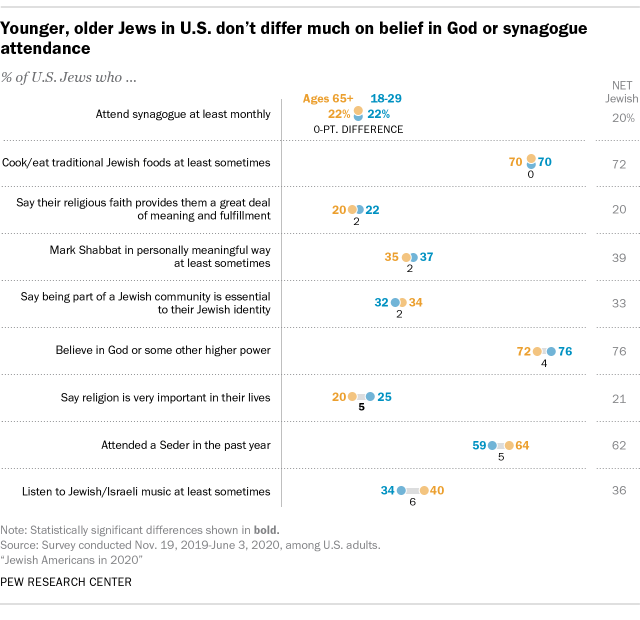
For example, Jews ages 18 to 29 are just as likely as those 65 and older to say they attend religious services at least monthly (22% each) and about as likely to say they believe in God or some other higher power (76% and 72%).
Pew Research Center conducted this study to explore Jewish Americans’ self-identities, religious and cultural practices, political attitudes and more. This survey represents the Center’s most comprehensive, in-depth study of U.S. Jews, drawing on 4,718 U.S. adults who identify as Jewish, including 3,836 “Jews by religion” and 882 “Jews of no religion.” The survey was administered online and by mail by Westat from Nov. 19, 2019, to June 3, 2020. Respondents were drawn from a national, stratified random sampling of residential mailing addresses, which included addresses from all 50 states and the District of Columbia. No lists of common Jewish names, membership rolls of Jewish organizations or other indicators of Jewishness were used to draw the sample.
The sample is nationally representative and was weighted to align with demographic benchmarks for the U.S. adult population from the Census Bureau as well as a set of modeled estimates for the religious and demographic composition of eligible adults within the larger U.S. adult population.
Here are the questions used for the report, along with responses, and its methodology.
More broadly, younger and older Jews participate at similar rates in a wide range of cultural and religious expressions of Jewishness. Seven-in-ten people in both age groups say they at least sometimes cook or eat traditional Jewish foods, while roughly six-in-ten in both groups say they attended a Passover Seder in the year prior to the survey.
Younger and older Jewish adults are about equally likely to say they visit historic Jewish sites when traveling (60% and 61%). Roughly a third in both groups say that they at least sometimes mark Shabbat in a personally meaningful way and that being part of a Jewish community is an essential part of what being Jewish means to them.
And there is no gap when it comes to political affiliation: About seven-in-ten Jews in the youngest and oldest age groups say they identify with or lean toward the Democratic Party (70% and 72%).
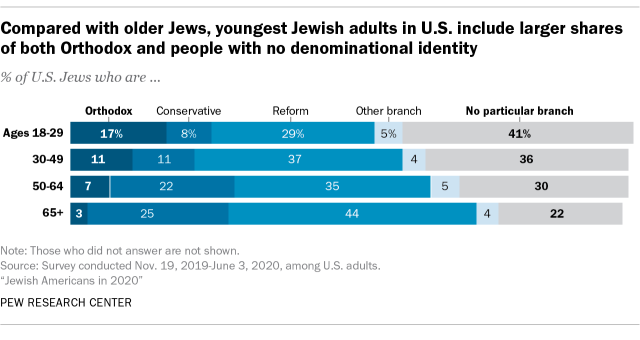
But that’s only part of the story. On many other issues, America’s youngest and oldest Jewish adults are very different. To begin with, younger Jews are more likely than older Jews to be Orthodox (17% vs. 3%). At the same time, they are also more likely not to identify with any institutional branch or stream of American Judaism (41% vs. 22%). Only about four-in-ten Jewish adults under 30 identify with either Reform (29%) or Conservative Judaism (8%), compared with seven-in-ten Jews ages 65 and older.
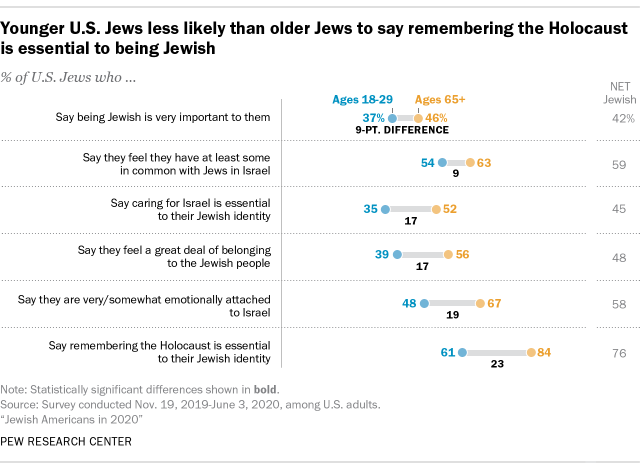
There is also an age gap among Jewish Americans on attitudes toward Israel. For example, Jews ages 18 to 29 are less likely than those 65 and older to say they are at least somewhat emotionally attached to Israel (48% vs. 67%) and that caring about Israel is essential to what being Jewish means to them (35% vs. 52%). They also are less likely to say they have a lot or some in common with Jews in Israel (54% vs. 63%).
Younger and older Jewish Americans also differ on questions of family, connection to other Jews, and passing Judaism to future generations.
While younger Jews are about as likely as their older counterparts to say being part of a Jewish community is an essential part of being Jewish, they are less likely than older Jews to say they feel a great deal of belonging to the Jewish people (39% vs. 56%) or that being Jewish is very important in their lives (37% vs. 46%). Younger Jews also are less likely to say that remembering the Holocaust is essential to their Jewish identity (61% vs. 84%).
In addition, younger Jews assign less importance to the prospect of their descendants being Jewish. Jews ages 18 to 29 are less likely than those 65 and older to say it’s at least somewhat important that their grandchildren be Jewish (57% vs. 67%) or that it’s at least somewhat important that their grandchildren marry someone who is Jewish (36% vs. 56%). (This hypothetical question was asked of all respondents, whether or not they currently have any grandchildren.)
These patterns may, in part, reflect higher levels of intermarriage in younger families. Only around half of Jewish adults ages 18 to 29 have two Jewish parents (49%), compared with the vast majority of Jews 65 and older (89%).
When it comes to race and ethnicity, young Jews are more diverse than their elders. Among Jews ages 18 to 29, 15% identify as Hispanic, Black, Asian, some other (non-White) race or ethnicity or multiracial, compared with just 3% among Jews who are 65 and older.
On sexual orientation, the survey finds that Jews ages 18 to 29 are less likely than Jews 65 and older to say they are straight (75% vs. 96%), and more likely to say they are gay or lesbian (7% vs. 1%) or bisexual (13% vs. 1%). But these patterns are hardly unique to Jews. The proportion of all Jewish adults who identify as straight (88%) is virtually the same as among the U.S. general population (89%), and the shares of Jews in the youngest and oldest age groups who say they are straight are on par with those shares among U.S. adults overall who say the same.
