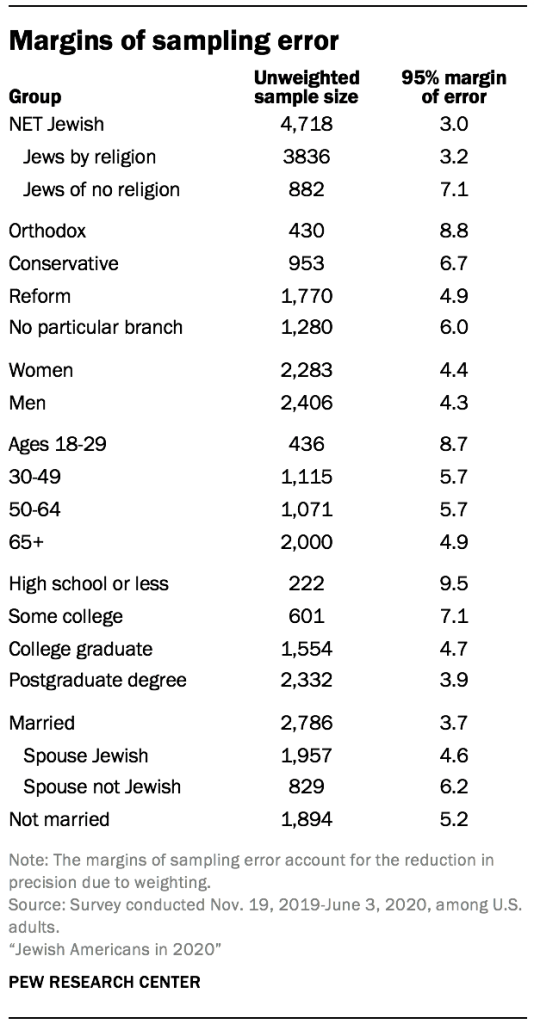
The data in this report is drawn from a national cross-sectional, address-based sampling (ABS) survey conducted for Pew Research Center by Westat. This survey was fielded Nov. 19, 2019, through June 3, 2020. Self-administered screening interviews were conducted with a total of 68,398 U.S. adults either online or by mail, resulting in 4,718 interviews with Jewish adults who are the primary subject of this report. This included 3,836 who are Jewish by religion and 882 who consider themselves Jewish but not by religion. Another 1,163 interviews were conducted with adults who are not Jewish (according to the criteria used in this report) but have a Jewish background or other Jewish affinity. After accounting for the complex sample design and loss of precision due to weighting, the margin of sampling error for the 4,718 net Jewish respondents is plus or minus 3.0 percentage points at the 95% level of confidence.
The survey was administered in two stages. In the first stage, a short screening survey was administered to a national sample of U.S. adults to collect basic demographics and determine a respondent’s eligibility for the extended survey of Jewish Americans. Screener respondents were considered eligible for the extended survey if they met any of the following three conditions:
- They identified as Jewish when asked about their religious identity.
- They did not identify as Jewish by religion but said that they consider themselves to be Jewish in any other way, such as ethnically, culturally or because of their family’s background.
- They did not identify as Jewish at all but indicated that they were raised in the Jewish tradition or had a Jewish parent.
The screener was also used to identify eligible respondents for a separate study focused on the religious experiences of Black Americans.49 This was done primarily for efficiency, since both populations make up a relatively small share of the total U.S. adult population and obtaining a sufficient sample size for either group requires screening a much larger number of adults. For the small number of respondents who were eligible for both surveys, a random 80% were assigned to the extended Jewish American survey and the remaining 20% were assigned to the survey of Black Americans. The weights for these respondents were adjusted upward proportionately to account for this subsampling and ensure that the population of Black Jews was not underrepresented in the samples of either study.50
Throughout this appendix, the terms “extended survey” and “extended questionnaire” refer to the extended survey of Jewish Americans that is the focus of this report, and “eligible adults” and “eligible respondents” refer to those individuals who met its eligibility criteria, unless otherwise noted.
Sample design
The survey had a complex sample design constructed to maximize efficiency in reaching Jewish adults while also supporting reliable, national estimates for this population. The study used a stratified, systematic sample of U.S. residential mailing addresses. The ABS frame originates from the U.S. Postal Service’s Computerized Delivery Sequence File (CDSF) updated every month. That frame is maintained by Marketing Systems Group (MSG). MSG geocodes their entire ABS frame, so block, block group and census tract characteristics from the decennial census and the American Community Survey (ACS) can be appended to addresses and used for sampling and data collection purposes. The stratification of the sampling frame and the assignment of differential sampling rates to the strata were a critical design component because of the rareness of the eligible populations. Because the Jewish population was much rarer than the Black population, the stratification mainly identified areas with high concentrations of Jewish adults.
The first source for identifying areas with a higher density of Jewish adults was a file made available to Pew Research Center by the American Jewish Population Project (AJPP) at Brandeis University. The U.S. government does not collect data that classifies people by religion, so the AJPP data is the best source available. The AJPP provided pre-release data for this purpose (Pre-Release Estimates, July 2019). The available tables were at the county or county-group level and had estimates of both the total number of adults and the proportion of adults who identified themselves as Jewish by religion for each county group. Based on the distribution of the proportion of Jewish adults by religion in the county groups, Westat partitioned the county groups into two classes based on estimated Jewish density (high and low).
The next step was to stratify the areas within the county groups in the high-density class. Pew Research Center provided data from surveys conducted in 2013 or later that contained the respondents’ religious affiliation, ZIP code and sampling weights. Westat used that data to estimate the proportion of Jewish adults at the ZIP code level. Unfortunately, the Census Bureau does not report population counts at the ZIP code level. Instead, the Census Bureau reports counts at the ZIP Code Tabulation Areas (ZCTAs) level. Westat implemented a crosswalk between ZCTA and ZIP codes and then produced estimates of the proportion of Jewish adults at the ZCTA level within county groups for those county groups in the high-density class.
Since the sample sizes in the ZCTAs from the Pew Research Center surveys were often very small, zero or missing, the estimates of the percentage of Jewish adults in the ZCTA were not precise. As a result, each county group in the high-density class was partitioned into just two pieces within the county group. The first part included all ZCTAs with the highest estimated percentage of Jews by religion in the county group, and the other had the remainder of ZCTAs. Westat assigned all high-density ZCTAs to stratum 1. The lower-density ZCTAs were placed in stratum 2. The county groups or individual counties in the low-density class were placed in stratum 3.
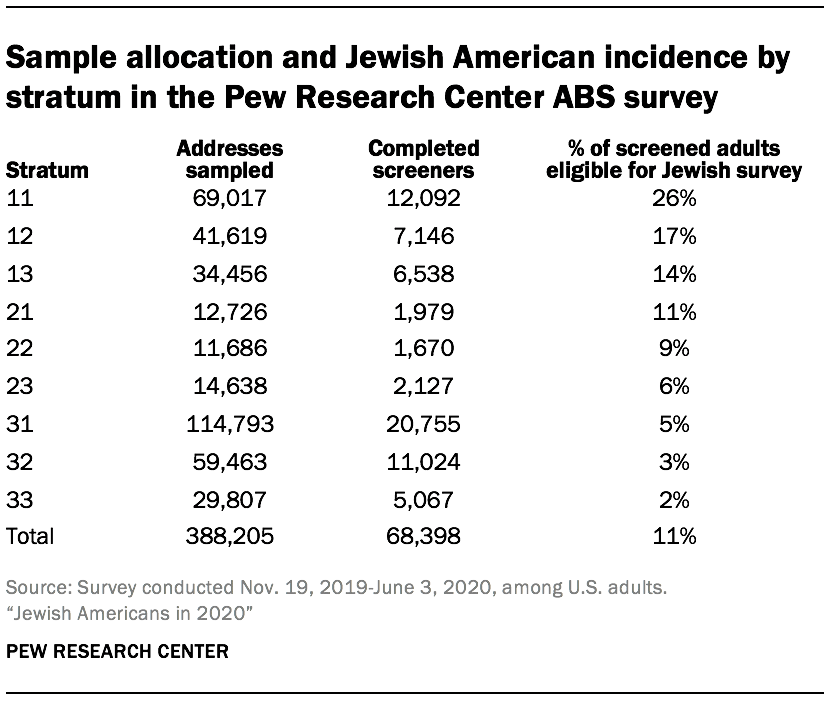
The last step in the stratification divided each stratum into three substrata. For the higher-density strata (1 and 2), the substratum boundaries were determined using the square root of the ZCTA-level estimate of the number of Jewish adults. In the lowest-density stratum (3), the substratum boundaries were based on the estimated number of Jewish adults in the county group.
Westat divided the sample of drawn addresses into two replicate subsamples. At the beginning of data collection, Westat only mailed to the first replicate of addresses. About two months later, Westat began mailing the second replicate of addresses. This approach allowed researchers to evaluate the performance of the data collection protocol and apply adjustments before the second replicate was fielded. From the first replicate, it was clear that the response rate to the screening interview was lower than projected. To address the shortfall, Westat supplemented the sample with additional addresses and made small changes to the study materials.
One of the changes implemented between replicates was to the procedure used to randomly select one adult from each sample household. In the first replicate, each sampled address was randomly assigned to one of four groups, referred to as YM, OM, YF or OF. In group YM, the youngest male adult is sampled (if there are no males, the youngest female is sampled). Group OM samples the oldest male (or oldest female if no males present). YF and OF are the analogous groups for sampling women by age. After the first replicate fell short of yield projections, a simpler selection procedure was used; the adult in the household with the next birthday was instructed to complete the survey. The next-birthday method was also used for the last two screener recruitment mailings for the first replicate.
Data collection
To maximize response, the study used a sequential mixed-mode protocol in which sampled households were first directed to respond online and later mailed a paper version of the questionnaire if they did not respond online.
The first mailing was a letter introducing the study and providing the information necessary (URL and unique PIN) for online response. A pre-incentive of $2 was included. This and remaining screener recruitment letters focused on the screener survey, without mentioning the possibility of eligibility for longer surveys and associated promised incentive, since most people would only be asked to complete the short screening survey.
Next, Westat sent a postcard reminder, followed by a reminder letter to nonrespondents. Westat later sent nonrespondents a paper version screening survey, which was a four-page booklet (one folded 11×17 paper) and a postage-paid return envelope in addition to the cover letter. If no response was obtained from those four mailings, no further contact was made.
Eligible adults who completed the screening interview on the web were immediately asked to continue with the extended questionnaire. If an eligible adult completed the screener online but did not complete the extended interview, Westat sent them a reminder letter. This was performed on a rolling basis when it had been at least one week since the web breakoff. Names were not collected until the end of the web survey, so these letters were addressed to “Recent Participant,” but the content of the letter referenced the reported age and sex of the participant when available, so that the same participant would continue the survey.
If an eligible respondent completed a paper screener, Westat mailed them the appropriate extended survey and a postage-paid return envelope. This was sent weekly as completed paper screeners arrived. The paper screeners asked for a “first name or initials in case we have any questions about your survey,” and Westat addressed the extended mailings using this information. The content of the letter also referenced the reported age and sex of the participant when available. Westat followed these paper mailings with a reminder postcard. Later, Westat sent a final paper version via FedEx to eligible adults who had not completed the extended interview online or by paper.
Incentives
In addition to the $2 prepaid incentive that was included in the initial mailing sent to all sampled addresses, screener respondents who were eligible for the extended questionnaire were offered an additional promised incentive to be paid upon completion. Its value differed depending on how and when the respondent completed the screener. For the first sample replicate, respondents who completed the screener online were offered either $10 or $20 at random as part of an experiment to determine whether the response rate was sensitive to the promised value. The experiment found that the higher incentive did not result in significantly greater participation. Consequently, all eligible respondents who completed the screener online after the start of the second sample replicate were offered $10. Respondents who were sent a paper version of the extended questionnaire, either because they completed the screener by paper or because they never finished the extended questionnaire online, were offered $50.
Languages
The self-administered mail and web screening surveys were developed in English and translated into Spanish and Russian. For web, the landing page was in English, with language selection buttons available on that page to anyone, and throughout the survey, to change to Spanish or Russian. The paper screener was also formatted in English, Spanish and Russian. Recipients thought to be more likely to make use of Spanish or Russian options, based on supplemental information on the sampling frame or their address location, were sent the Spanish or Russian paper screener in addition to the English one.
The Jewish extended survey was available in English and Russian. For web, respondents continued in their selected language from the screener. Those receiving a paper extended instrument were sent the language corresponding to the language in which the screener was completed. In the rare occurrence that someone selected for the Jewish extended survey completed the screener in Spanish, the extended instrument was provided in English.
Weighting and variance estimation
Household-level weighting
The first step in weighting was the creation of a base weight equal to the inverse of each household’s probability of selection as determined by the stratum from which it was sampled. The base weight for mailing address k is called BWk, defined as the inverse of its probability of selection.
Each sampled mailing address was assigned to one of four categories according to its final screener disposition. The categories were 1) eligible household with one or more adults with a completed screener interview, 2) eligible household with one or more adults without a completed screener interview, 3) ineligible (i.e., not a household, which were primarily postmaster returns), and 4) household with unknown eligibility (addresses that were not identified as undeliverable by the post office but from which no survey response was received).
The first step in adjusting the base weight accounted for eligible sampled addresses among those with unknown eligibility (category 4). Previous ABS studies have found that about 13% of all addresses in the ABS frame were either vacant or are not home to anyone in the civilian, non-institutionalized population. For this survey, we assumed that 87% of all sampled addresses were eligible households. Thus, we adjusted the base weight in category 4, so the weights represented the portion of cases assumed to be eligible. The value of the adjustment factor was computed so that the sum of the base weights in categories 1 and 2 (eligible respondents and nonrespondents) and the adjusted cases in category 4 represented 87% of the frame total. The category 3 ineligible addresses are then given a weight of zero. We referred to this adjusted base weight as BW1k = BWk x p where p is the assumed eligibility factor applied to addresses in category 4. The weights in categories 1 and 2 were not adjusted; however, the sum of weights in categories 1, 2, and adjusted weights in 4 summed to the total for all eligible nonrespondents.
The next step allocated the weights from assumed eligible cases in category 4 to the weights in categories 1 (screener interview eligible respondents) and 2 (screener interview eligible nonrespondents). The adjustment was done separately by weighting classes derived from auxiliary data available at the address level. A separate weighting class was created to target the adjustment for the addresses in three counties identified as having a large Orthodox Jewish density (Kings and Rockland counties in New York and Ocean County in New Jersey). The remaining classes were defined by the cross-classification of sampling strata, the Black sampling sub-strata, and the census region definition. These variables defined an initial set of 64 classes. Those classes with fewer than 150 sampled addresses were collapsed. There were 60 classes after collapsing. The nonresponse adjustment factor FW1c for this adjustment was the ratio of thee sum of the BW1 weights divided by thee sum of the BW1 of the respondents in the same class c as FBW1c = ΣchBW1hk/∑resp∈hBW1hk. The adjusted weight is BW2hk = FBW1c x BW1hk.
The next step was adjusting for nonresponse for households without a completed screener interview. This adjustment allocated the weights of nonrespondents (category 2) to those of respondents (category 1). The adjustment was done separately by the same weighting classes used for the previous adjustment. The nonresponse adjustment factor FBW2c for this adjustment was the ratio of the sum of the BW2 weights divided by the sum of the BW2 of the respondents in the same class c as FBW2c = ΣchBW2hk/∑resp∈hBW2hk. The adjusted weight is BW3hk = FBW2c x BW2hk.
Weighting screened adults
To create an adult-level weight for all of the adults who completed the screener interview, the household weights were adjusted to account for randomly sampling one adult in each household. The initial adult level weight is AW1k = BW3k x ak is the number of adults in the household capped at 3 to avoid highly influential weights.51 Thee adult weights (AW1k) were then raked to match a set of estimated population benchmarks. The adult raked weight was ARKWck = AW1k x RKc, where RKc was the common adjustment for thee set of respondent characteristics c.
The raking dimensions for the adult weights were:
- Eligibility type by sex
- Eligibility type by age
- Eligibility type by education
- Orthodox stratum by sex52
- Age by education
- Single/multiple-adult household by presence of children in household
- Race and Hispanic ethnicity
- Census region
- Sampling stratum
Because eligibility type is not a variable for which external benchmarks exist, the weighting parameters instead use model-based estimates for the number of adults in each of the groups that determined eligibility for the extended survey: 1) adults who consider themselves Jewish by religion, 2) adults who are not Jewish by religion but consider themselves Jewish for other reasons, 3) adults who do not consider themselves Jewish but were raised Jewish or had a Jewish parent, and 4) ineligible adults.
Modeling made it possible to estimate the size and demographic composition of the eligible adult population while adjusting for both the complex sample design and a larger number of variables and their interactions than would otherwise be possible. This was done to correct for subtle nonresponse patterns that, while negligible in their impact on national estimates for the full U.S. adult population, had an outsize effect on the size and composition of the responding Jewish sample. The process used to produce the modeled estimates is detailed in the next section.
Initial weighting of extended survey respondents
The eligible adults who completed the extended interview were assigned an initial Jewish interview weight equal to ARKWk. Because of the high skewness of the distribution of the weights for the cases sampled for the Jewish survey, the weights were trimmed at the 95th percentile and then adjusted to account for the subsampling of the respondents who were eligible for both the Jewish American and Black American surveys.
This weight was then raked to align with a set of parameters that were also based on modeled estimates for the demographic composition for the Jewish categories discussed in this report: 1) Jews by religion, 2) Jews of no religion, and 3) adults with a Jewish background or affinity. The model also distinguished between Orthodox and non-Orthodox Jews by religion. The specific raking dimensions for the extended weight were:
- Jewish category by Orthodox/non-Orthodox
- Jewish category by age
- Jewish category by education
- Orthodox stratum by sex
- Census region
- Sampling stratum
- Single/multiple-adult household by presence of children in household
To reduce the variability of the weights while preserving the relative size of the Jewish population segments, the raked weights were then trimmed separately within each of the detailed Jewish categories at the 99.3rd percentile. This initial raked weight for the Jewish extended respondents is called EXTWTk.
Household roster weights
Part of the extended interview involved rostering all of the adults and children in each respondent’s household. To facilitate the analysis of the roster data, a household dataset was created that contained one row for every adult and child in each responding household. All persons in a household were given a household weight (EXTWTHHk) equal to the extended respondent’s initial weight (EXTWTk) divided by the number of eligible adults in the household. This accounts for the fact that household members would have been rostered if any eligible adult had been sampled other than the respondent.
Roster adjustment to extended respondent weights
A final adjustment was made to the weights for the extended interview respondents to correct an imbalance in the distribution of men and women in Orthodox households. Although Orthodox respondents were disproportionately male using the extended respondent weight (EXTWTk), the share of eligible men and women in Orthodox households was evenly balanced using the household weight (EXTWTHHk). Such an outcome would be highly unlikely if the responding adult were selected at random, and suggests a tendency in Orthodox households to choose a male respondent instead of the adult with the next birthday.
To correct this imbalance, the extended respondent weight was raked one more time so that the distributions of sex for Orthodox and non-Orthodox respondents matched the distribution all eligible rostered adults using the EXTWTHHk. The rostered distribution for Jewish category was also included as a raking dimension for this step to ensure consistency between the household and respondent weights. This final weight, EXTWTFINk, is used for the bulk of the analysis in this report.
Variance estimation
Because the modeled estimates used in the weighting are themselves subject to sampling error, variance estimation and tests of statistical significance were performed using the grouped jackknife estimator (JK2). One hundred sets of replicates were created by deleting a group of cases within each stratum from each replicate and doubling the weights for a corresponding set of cases in the same stratum. The entire weighting and modeling process was performed on the full sample and then separately repeated for each replicate. The result is a total of 101 separate weights for each respondent that have incorporated the variability from both the complex sample design, modeling and estimation of weighting parameters.53
Model-based population estimates
As previously mentioned, the weights for the survey of Jewish Americans rely on model-based estimates for the size and demographic composition of the eligible adult population. Whereas design-based estimation depends on knowing each individual’s probability of inclusion in the sample, model-based estimation involves fitting a regression model to the survey data predicting an outcome variable of interest as a function of a set of covariates whose distributions are known for both the individuals in the sample and for the larger target population. That model is then used to obtain predicted values of the outcome for all of the non-sampled individuals in the population.54
Modeling screener eligibility
The first stage in modeling the size and composition of the eligible adult population was to fit a model predicting whether an adult respondent to the screener was eligible for the extended survey because they either 1) identified their religion as Jewish, 2) did not identify as Jewish by religion but indicated that they consider themselves to be Jewish for reasons aside from religion, or 3) did not consider themselves Jewish but had a Jewish parent or Jewish background; or 4) whether they were not eligible. This step was intended to correct for screener nonresponse that may have been associated with eligibility for the extended interview.
To ensure that the modeling accounted for the informative sample design, sampling stratum and the number of adults in the household were included in the model as predictors. Additional demographic predictors included age, sex, race and Hispanic ethnicity, and an indicator for the presence of children in the household. Geographic predictors included a flag identifying respondents residing in one of the three high-density Orthodox counties, a measure of urbanicity based on the National Center for Health Statistics’ urban-rural county classifications, census region, and a geographic grouping variable. The geographic group was defined as county for those counties that had at least 300 respondents to the screener. Counties with fewer than 300 respondents were grouped according to state. Any remaining groups that still did not have 300 respondents were combined according to census division. This resulted in a total of 79 groups, of which only the Pacific remainder (n=236) and East-South-Central remainder (n=163) had fewer than 300 respondents.
The model was fit using multinomial logistic ridge regression as implemented in the glmnet package for the R statistical computing platform.55 Ridge regression is a form of penalized regression that allows for the inclusion of a large number of predictor variables and interactions by shrinking the coefficients for irrelevant variables to be very close to zero. It performs particularly well when many of the predictors are correlated with each other, as was the case here.
The model included main effects for all of the predictor variables listed above. Interaction terms were selected using repeated 10-fold cross-validation. In 10-fold cross-validation, the full sample is randomly divided into 10 equally sized groups. Sequentially, each group is removed from the full sample and a set of candidate models is fit to the remaining 90% of the data. The models’ out-of-sample predictive accuracy is then measured on the 10% that was withheld. The model specification with the best average performance across all 10 groups is then chosen as the final model.
To select the final model specification, every possible two-way interaction between predictors was first ranked according to the cross-validated performance of a model containing only main effects and the single interaction. Then, interaction terms were cumulatively added to a base model one at a time. Interaction terms were retained in the cumulative model if their inclusion led to cross-validated performance that was as good as or better than the cumulative model, otherwise they were dropped. Interaction terms that included geographic group were added to the cumulative model last due to the very large number of additional coefficients that they entail. The specification that had the best performance in cross-validation was then fit to the full dataset with all 68,398 screener respondents to create the final model.
Modeling Jewish category
The second stage of modeling was intended to correct for nonresponse to the extended interview among eligible adult respondents. In particular, the goal was to correct nonresponse that was differentially associated with important segments of the Jewish population. For this stage, a model predicting whether someone was 1) Jewish by religion and Orthodox, 2) Jewish by religion but not Orthodox, 3) Jewish but not by religion, or 4) of Jewish background or Jewish affinity was fit to the data for the 5,881 eligible adults who completed the extended Jewish survey.
For predictors, this model added eligibility type to the list of variables used in the first stage. The model included main effects for all of the predictor variables with interactions selected using the same procedure as the first-stage model.
Creating a population frame
Using the models to generate population estimates requires knowing the complete distribution of all of the predictor variables that were used in the model fitting. The primary source for the distribution of the predictor variables was the 2018 ACS 5-year Public Use Microdata Sample (PUMS). The smallest geographic units on the PUMS are Public Use Microdata Areas (PUMAs), which do not directly correspond to the geographic units used in the modeling. Specifically, counties are needed to create variables for high-density Orthodox counties, urbanicity and geographic group. Additionally, the strata used in the sample design require the cross-classification of both county and ZIP code.
To solve this problem, the PUMS was merged with a crosswalk identifying the proportion of each PUMA’s population that lives in any of the counties with which it intersects. The weights for each person in the dataset were then distributed across counties proportionate to their share of the PUMA’s population. Then, a similar crosswalk was used to further allocate each person’s weights proportionately across the ZIP Code Tabulation Areas (ZCTAs) that intersect with their county. Both crosswalks were obtained from the Missouri Census Data Center’s Geocorr 2014.
Appending county and ZCTA to the PUMS made it possible to create all of the geographic variables that were used in the modeling. A variable identifying the groups of ZCTAs that crossed stratum boundaries was also created. Each record in this augmented PUMS dataset was grouped into cells defined by the cross-classification of housing type, ZCTA groups and all of the predictor variables used in the modeling and their weights were summed to create a dataset with one row for every unique combination of predictor variables and a weight identifying the total number of people in that cell.
Because allocating weights proportionately across counties and ZCTAs is only a rough approximation, these weights were then raked so that the distributions for age, sex, race and Hispanic ethnicity within counties aligned with 2018 estimates from the Census Bureau’s Population Estimates Program (PEP). The raking also aligned the distribution of age by education separately within counties and ZCTA groups, respectively, to match estimates from the 2018 5-Year ACS tables. Finally, the dataset was filtered to only the records for the non-institutionalized adult and the calibrated weights were scaled so that their sum matched the 2018 ACS 5-year PUMS.
Next, the first-stage model was applied to this population frame to predict the proportion of adults in each cell who belong to each eligibility category. These proportions were multiplied by the total number of adults to create new cells for each of the eligibility categories. The second-stage model was then used to further subdivide the cells for eligible adults according to Jewish category.
The end result is a dataset with one row for every unique combination of the predictor variables, eligibility type and detailed Jewish category with a weight reflecting the estimated number of adults in each. This final dataset was then used to compute the estimated population benchmarks that were used in the weighting discussed above.
Response rates
Westat assigned all sampled cases a result code for their participation in the screener, and then they assigned a result for the extended questionnaire for those who were eligible for the survey of Jewish Americans. Two of the dispositions warrant some discussion. One is the category “4.313 No such address.” This category is for addresses that were returned by the U.S. Postal Service as not being deliverable. This status indicates the address, which was on the USPS Delivery Sequence File at the time of sampling, currently is not occupied or no longer exists. The second category is “4.90 Other.” This category contains 1,231 addresses that were never mailed because they had a drop count of greater than four. Drop points are addresses with multiple households that share the same address. The information available in the ABS frame on drop points is limited to the number of drop points at the address, without information on the type of households at the drop point, or how they should be labeled for mailing purposes. In this survey, all drop points were eligible for sampling, but only those with drop point counts of four or fewer were mailed. Westat treated drop point counts of five or more as out of scope, and no mailing was done for those addresses.
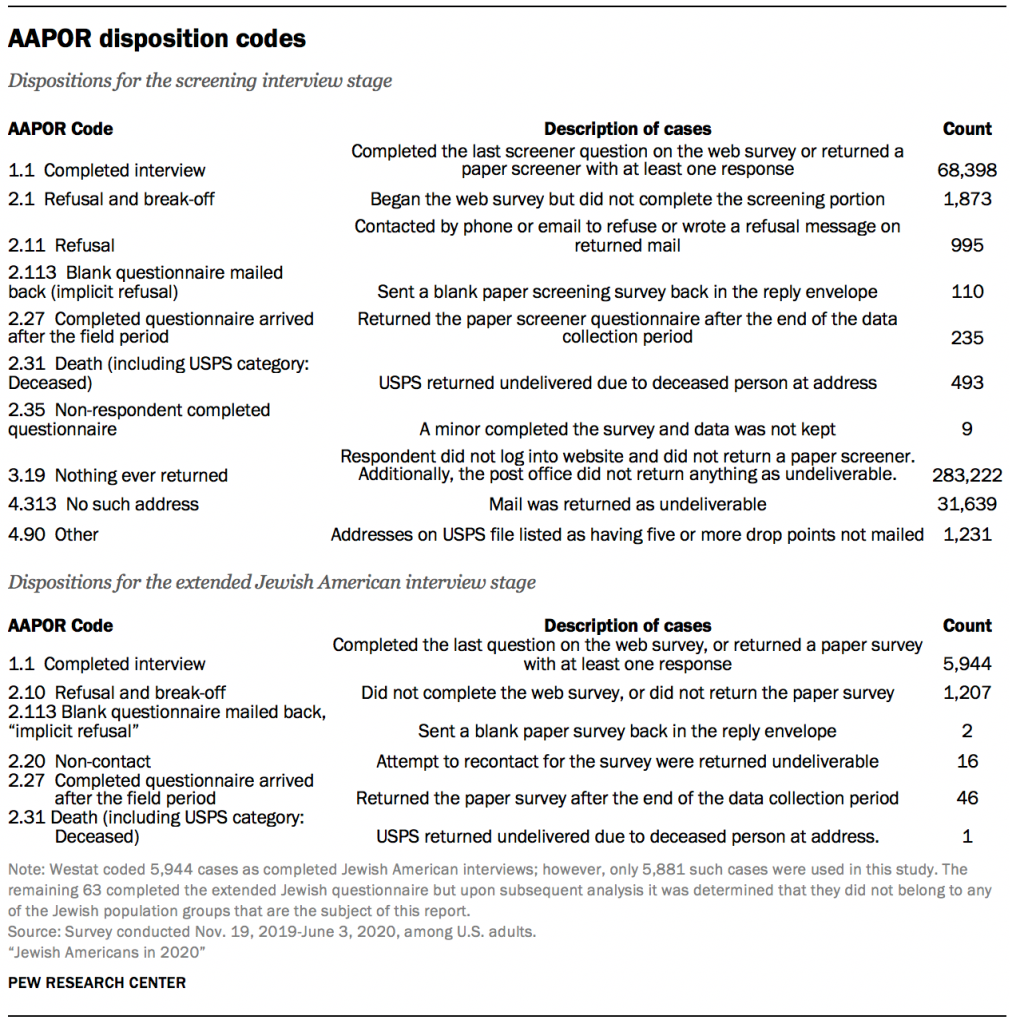
Westat used the disposition results to compute response rates consistent with AAPOR definitions. The response rates are weighted to account for the differential sampling in this survey. The weight is the inverse of the probability of selecting the address.56 The AAPOR RR3 response rate to the screening interview was 20.1%.57 The RR3 response rate to the extended Jewish American interview, 82.4%, is the number of eligible adults completing the questionnaire over the total sampled for that extended questionnaire. The overall response rate is the product of the screener response rate and the conditional response rate for the extended questionnaire. The overall response rate for the Jewish American sample in the Pew Research Center ABS survey was 16.6% (20.1% x 82.4%).
Acknowledgments
Many individuals contributed to this study’s data collection and methodology. In particular, Pew Research Center is grateful to Hanna Popick, Eric Jodts, Mike Brick and Ismael Flores Cervantes from Westat and to Elizabeth Tighe from the American Jewish Population Project for their many contributions to this project.