The present study is the second time Pew Research Center has conducted a national survey of the U.S. Jewish population. A key research question is whether the new survey found any significant changes within the Jewish population during the past seven years. But the change in research design implemented in 2020 complicates comparisons to the 2013 results. The 2013 study was a live telephone survey using a landline and cellphone random-digit-dial sample. The 2020 study offered online or paper response and used an address-based sample. In theory, differences between 2013 and 2020 estimates could reflect real change in the Jewish population, or they could be an artifact of the change in methods – either the sampling method, the mode of interview or both.
To gather hard data on this question, the Center commissioned an experiment that ran parallel to the main study. The experiment was conducted by the same firm conducting the main survey, Westat, and randomly assigned Jewish adults to be interviewed using the 2013 method (live telephone) or the 2020 method (online or paper response). If the two experimental groups yielded similar estimates, it would suggest that the change in mode of response does not affect the comparability of the 2013 and 2020 results. Conversely, if the experiment returned divergent results from the two groups, it would suggest that readers exercise caution in comparing the 2013 and 2020 results.
By randomly assigning mode of response, the experiment addresses whether the change in survey design from 2013 to 2020 affected how people answered the questions. The experiment was not designed, however, to determine whether the design change affected who participated in the study. The latter question is germane because the predominantly landline design used in 2013 theoretically could be more effective in reaching certain parts of the population (e.g., older adults), while the predominantly online design used in 2020 could be more effective at reaching other subgroups (e.g., younger adults).
In other words, the design change from 2013 to 2020 raises two questions about comparability:
- Did the change affect how Jewish adults answered questions?
- Did the change affect the composition of the Jewish sample?
The mode experiment was designed directly to address only the first question. Answering the second question would require fielding the 2020 study with both the new address-based sample design (ABS) and the 2013 random-digit-dial (RDD) design. Surveying large samples of U.S. Jews using both designs in 2020 would have been prohibitively expensive.
In both experimental modes, the extended survey was administered to respondents who met one of three criteria:
- They identified as Jewish when asked about their religious identity.
- They did not identify as Jewish by religion but said that they consider themselves to be Jewish in any other way, such as ethnically, culturally or because of their family’s background.
- They did not identify as Jewish at all but indicated that they were raised in the Jewish tradition or had a Jewish parent.
The following analysis is based only on the subset of qualified respondents who are Jewish, including Jews by religion (i.e., people who describe themselves as Jewish when asked about their religious identity) and Jews of no religion (i.e., people who describe themselves religiously as atheist, agnostic, or “nothing in particular” and who say “yes” when asked if they think of themselves as Jewish aside from religion and who were raised Jewish or by a Jewish parent). Those respondents who qualified for the experimental survey but who are not Jewish (e.g., because they are now adherents of a religion other than Judaism, or because they no longer think of themselves as Jewish in any way) are excluded from this analysis.
The experiment found divergent estimates from the telephone group versus the online/paper group on many but by no means all questions. Respondents in the telephone group were more likely to report attending Jewish religious services. They were also more likely to describe being Jewish as important to them. Questions with response options such as “some combination” or “both” exhibited large mode effects due to recency bias on the phone (see below for more), and refusal rates to sensitive questions were also higher when a live interviewer was present. These differences are consistent with known patterns of mode effects in other studies. However, the experiment found no meaningful differences between responses from Jewish adults interviewed by telephone versus those interviewed online/paper on the question of branch or stream of Judaism in the United States. Mode effects also were small or negligible when asking about concrete experiences without a socially desirable component, such as having had a bar or bat mitzvah. Based on these results, the 2020 report includes limited references to the 2013 results and, when doing so, focuses on questions where the experiment indicates little to no complication from the mode change.
Why the mode experiment was conducted
The present survey of U.S. Jews was conducted by mailing letters to sampled addresses inviting an adult member of the household to go online to take a survey. Those who did not respond online after the initial contact and reminders (e.g., an additional letter and a postcard) were mailed a paper version of the brief, screening survey to determine eligibility for the full questionnaire. All those deemed eligible were encouraged to complete the survey either online or on paper. This differs from the 2013 survey of U.S. Jews, which was conducted by live telephone interviewing with national samples of landline and cellphone numbers.
The chief difference between the design used in this study and in 2013 comes down to the mode of administration: Online and paper surveys are self-administered, while telephone surveys are administered by a live interviewer. In some instances, asking certain types of questions through self-administration will result in different answers than asking those same questions on the telephone, which is called a “mode effect.”
The live phone interviewing approach used in 2013 requires respondents to report their answers to a person who is essentially a stranger. This social interaction may exert subtle pressures on respondents that affect how they answer questions, particularly sensitive ones. For example, respondents may feel a need to present themselves in a more positive light to an interviewer, unconsciously leading them to overstate behaviors and attitudes they feel the interviewer would approve of – and vice versa, leading them to understate behaviors and attitudes they feel the interviewer might not like. This phenomenon is often referred to as “social desirability bias.”
There are also differences between modes in how respondents mentally process questions with multiple response options. On the phone, an interviewer reads the response options one by one, and respondents may find it easier to remember the last option that was read out, thus being more likely to select that option. This phenomenon is called a “recency effect.” By contrast, respondents to a web or paper survey who are faced with the prospect of reading multiple response options from top to bottom may gravitate more toward the top option – a phenomenon known as a “primacy effect.” The Center’s 2015 report on mode effects provides more detail.
How the mode experiment was conducted
In this experiment, a sample of households was randomly assigned to receive the screening and extended surveys using either the 2013 method (live telephone) or the 2020 method (online/paper). More cases were allocated to the telephone mode (16,851 sampled cases) than to the online/paper mode (9,663 sampled cases) due to lower expected response rates on telephone. In total, 1,744 adults were screened, and 1,032 qualified respondents completed the extended survey in the interviewer-administered live telephone group. In the online/paper group, 2,549 adults completed the screener, and 1,549 qualified respondents completed the extended survey. This analysis is based on the 903 phone respondents and the 1,387 online/paper respondents who are ultimately categorized as Jewish based on the same criteria used in the main study.

Telephone interviews were conducted from Dec. 10, 2019, to April 17, 2020, while the self-administered portion of the experiment was fielded Nov. 19, 2019, through June 3, 2020.
The experiment used a sample source that is more efficient for reaching the Jewish population than the main study. Approximately 70% of all adults screened for the experiment qualified as eligible for the extended survey, compared with 11% in the main study. The experiment used a listed sampling frame compiled from commercial databases linked to addresses and telephone numbers. The households in this list were determined by commercial data vendors to have a high likelihood of having a Jewish adult based on either a Jewish surname or other consumer data. To be eligible for the experiment, listed households needed to have both a mailing address and a telephone number on file. The vendor selected a random sample of those households and then randomly assigned them to respond by live telephone or by the online/paper protocol used in the 2020 main study.
This sample source was appropriate for the purpose of the experiment but not for the purpose of the main study. The aim of the experiment was solely to check for measurement differences between the two modes and not for making accurate inferences about the entire Jewish American population. While efficient, listed samples risk underrepresenting certain parts of the Jewish community, such as those without an identifiably Jewish name, as well as those with lower socioeconomic status who have less consumer information available to commercial data vendors. For the main study, by contrast, it was imperative to use a sample source that includes all U.S. adults. Only such a general population sampling frame can support high-quality estimates about the size, attitudes and experiences of the entire Jewish American population.
Propensity weighting was used to minimize compositional differences between the phone respondents versus the online/paper respondents
To isolate the effect of interview mode, the online/paper and telephone samples need to resemble each other as much as possible. While people were randomly assigned to each condition, differences in response patterns will result in compositional differences between the two samples. For example, 65% of those who completed the screener via telephone were ages 65 and older, compared with 53% in the online/paper condition.
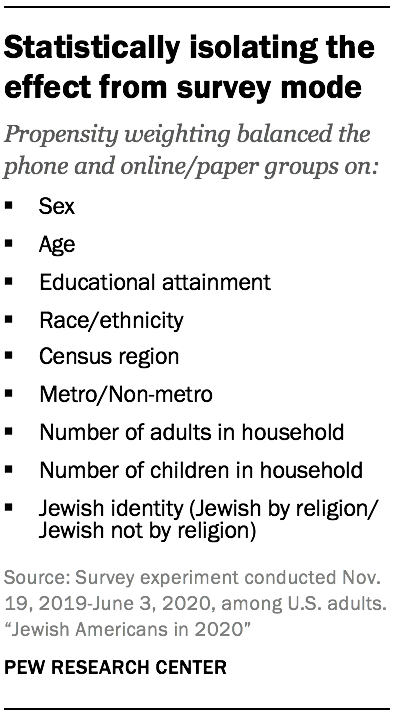
To address this, the phone cases were statistically adjusted using propensity weighting to resemble the online/paper sample with respect to sex, age, educational attainment, race/ethnicity, census region, metropolitan status, number of adults in the household and number of children in the household. The same adjustment was made for the phone cases who completed the extended survey, except that the weighting additionally balanced the phone cases to the online/paper sample with respect to type of eligibility (that is, whether the respondent stated in the screener that they considered themselves Jewish by religion, Jewish aside from religion – ethnically, culturally, etc. – or whether they did not consider themselves Jewish but were raised in that tradition or had a Jewish parent).
The analysis presented below incorporates these propensity weights. Note that neither of the samples in this experiment are weighted in a way that would support accurate population estimates. As such, the numbers below should be seen only as highlighting differences or similarities between phone and online/paper modes.
Phone and online/paper responses are similar for questions about branches of Judaism
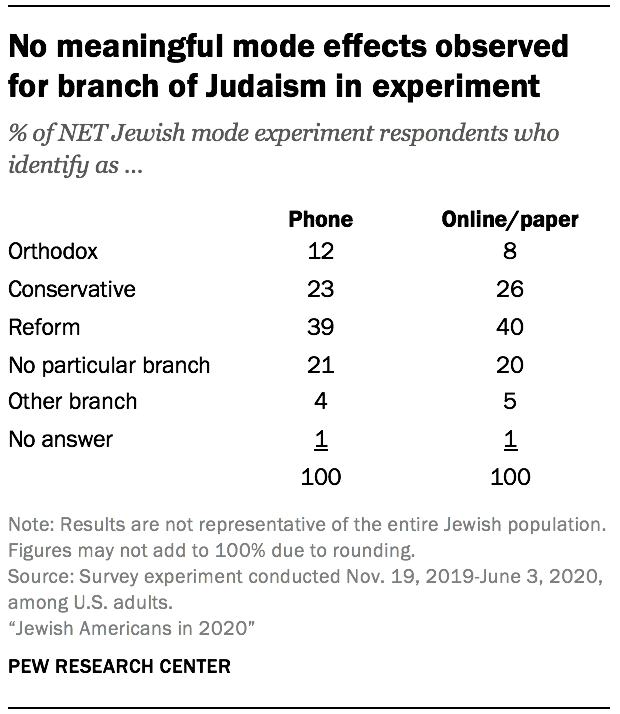
The mode experiment found no meaningful differences between responses from Jewish adults interviewed by telephone versus those interviewed online/paper on the question of their branch or stream of Judaism. The shares identifying as Reform, Conservative, Orthodox, other branches or no particular branch of Judaism were similar in both groups.
These results indicate that the change in mode from 2013 to 2020 did not affect the measurement on these questions. This gives confidence that the 2020 results can meaningfully be compared to those from 2013. This is consistent with research showing that behavioral questions that are salient, clearly phrased and free of strongly socially desirable answers are not generally susceptible to large mode effects.
Questions asking about concrete experiences generally did not exhibit discernible mode effects
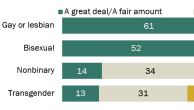
The experiment found that the phone and online/paper groups produced similar results for many questions about concrete experiences. For example, indistinguishable shares of online/paper (65%) and phone (66%) respondents said they had a bar or bat mitzvah when they were young. Similarly, nearly identical shares of phone and online/paper respondents said they attended a summer camp with Jewish content for one or more years (43% and 44%, respectively). The experiment also found similar results for a question about personal experiences with discrimination. Similar shares interviewed by phone and online/paper (10% and 14%, respectively) said they had been called offensive names in the past 12 months because of their Jewish identity or background.
Some questions appear to have a recency effect when asked on the phone
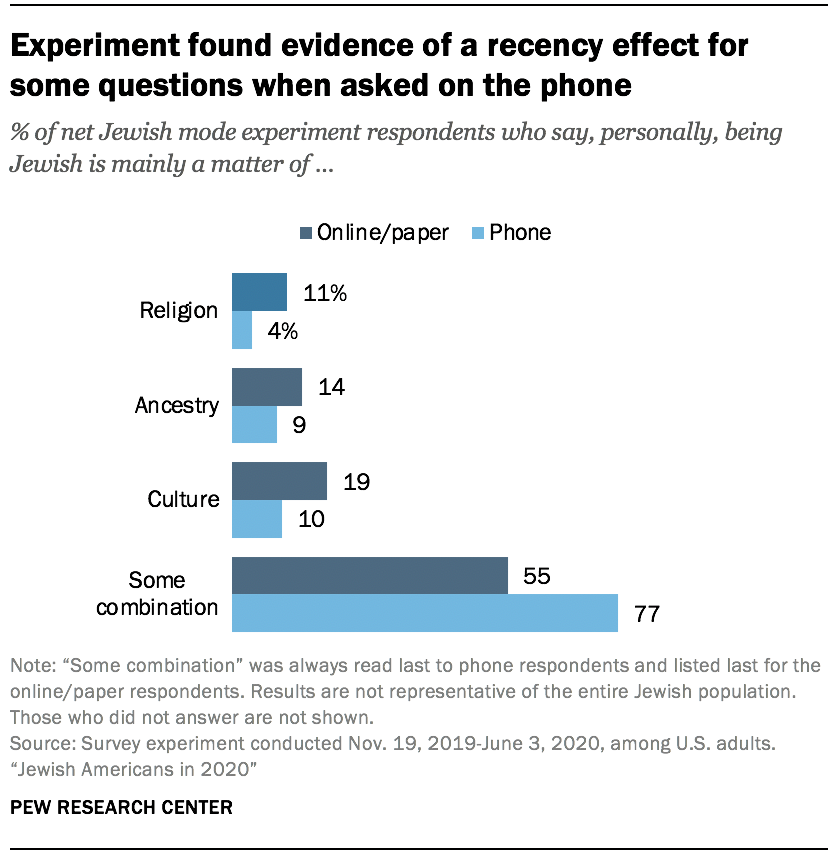
For some kinds of questions, it is best to give respondents an explicit response option such as “both” or “all of the above.” However, this can lead to sizable mode effects between self- and interviewer-administered modes. When asked whether for them, personally, being Jewish is mainly a matter of religion, ancestry, culture, or some combination of those three things, a much greater share of phone respondents (77%) compared with online/paper respondents (55%) responded in favor of some combination. This is, in part, most likely a recency effect in the sense that the “some combination” option must necessarily be read last on the phone, after all the other options have been read out.
The phone mode elicited higher refusal rates to sensitive or difficult questions
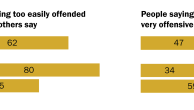
The experiment found higher rates of refusals on sensitive or difficult questions in the phone group than in the online/paper group. For example, when asked whether the current Israeli government is making a sincere effort to bring about a peace settlement with the Palestinians, the share declining to answer was higher in the phone group than in the online/paper group (9% vs. 3%). Similarly, 8% of phone respondents refused to answer whether they thought a way could be found for Israel and an independent Palestinian state to coexist peacefully with each other, compared with 3% of online/paper respondents. When asked whether or not God literally gave the land that is now Israel to the Jewish people, the refusal rate was 5% on the phone versus 2% in the online/paper group.
One example of a “classic” sensitive question is asking about the respondent’s family income in the previous year. This question elicits high rates of refusal across the board and showed a mode effect. Nearly one-quarter of phone respondents (23%) refused to answer, compared with 13% of the online/paper respondents.
Results corroborate research showing more bias in telephone interviews than in self-administered interviews for questions with socially desirable answers
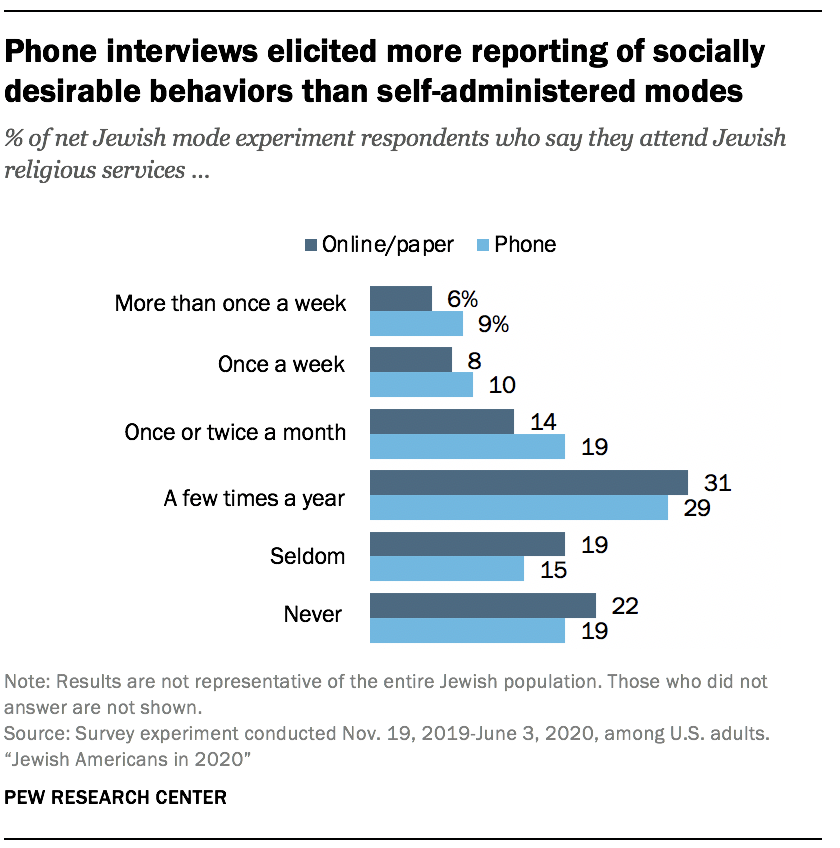
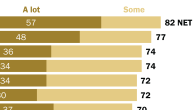
The experiment also found evidence for classical mode effects, in which the interviewer-administered mode (phone) elicited more reporting of socially desirable behaviors than the self-administered modes (online/paper). For example, the share of adults saying that they attend Jewish religious services monthly or more often was about 11 percentage points higher in the phone group than the online/paper group (38% vs. 27%). The phone group was also slightly more likely than the online/paper group to report keeping kosher (22% vs. 17%) and to report holding or attending a Seder last Passover (80% vs. 76%).
Similarly, a greater share of phone respondents (63%) than online/paper respondents (56%) said that religion was “very” or “somewhat” important in their life. In the same vein, 88% of phone respondents said being Jewish was “very” or “somewhat” important in their life, compared with 83% of online/paper respondents.
There was also a clear mode effect for the question “How emotionally attached are you to Israel?” The share saying they are “very attached” was 8 percentage points higher on the phone than online/paper (38% vs. 30%, respectively). This result is consistent with prior general population mode experiments by Pew Research Center that have found people are more likely to give kind or supportive responses on the phone to an interviewer and more likely to express extremely negative or unkind attitudes when responding alone online.
Conclusions from the mode experiment
While there is, strictly speaking, no way to determine whether the online/paper or phone responses are more accurate, previous research examining questions for which the true value is known has found that self-administered surveys generally elicit more accurate information than interviewer-administered surveys. Online/paper measurements on questions susceptible to social desirability reflect a greater level of candidness, for example. Sensitive questions are also refused less often when asked via online/paper, as more people are willing to provide an opinion or information about themselves (such as household income) when an interviewer is not involved. Also, large differences in questions providing the option to indicate that multiple choices apply highlight the possibility that some attitudes measured are not well-formed, making it difficult to discern which measurement mode is more accurate. Fortunately, such questions are rare in this study.
For questions yielding a sizable difference in the mode experiment, Center researchers refrained from trending the 2020 results back to 2013. However, the report does discuss the trend for a limited number of questions where the mode experiment found no substantial measurement differences between the phone and online/paper groups. Future studies of the Jewish American population that use the online/paper design deployed in 2020 should be able to trend to the current study’s results without the complications of a mode change.58