
This is a Pew Research Center report from the Pew-Knight Initiative, a research program funded jointly by The Pew Charitable Trusts and the John S. and James L. Knight Foundation.
The American Trends Panel survey methodology
Overview
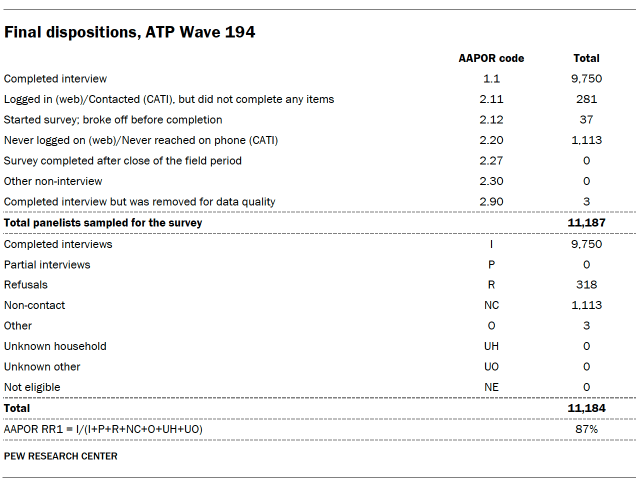
Data in this report comes from Wave 194 of the American Trends Panel (ATP), Pew Research Center’s nationally representative panel of randomly selected U.S. adults. The survey was conducted from May 26 to June 1, 2026. A total of 9,750 panelists responded out of 11,184 who were sampled, for a survey-level response rate of 87%.
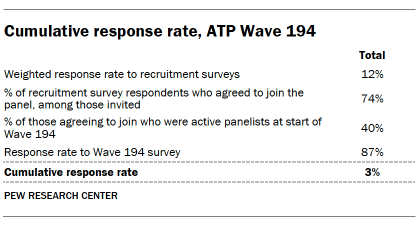
The cumulative response rate accounting for nonresponse to the recruitment surveys and attrition is 3%. The break-off rate among panelists who logged on to the survey and completed at least one item is less than 1%. The margin of sampling error for the full sample of 9,750 respondents is plus or minus 1.4 percentage points.
SSRS conducted the survey for Pew Research Center via online (n=9,464) and live telephone (n=286) interviewing. Interviews were conducted in both English and Spanish.
To learn more about the ATP, read “About the American Trends Panel.”
Panel recruitment
Since 2018, the ATP has used address-based sampling (ABS) for recruitment. A study cover letter and a pre-incentive are mailed to a stratified, random sample of households selected from the U.S. Postal Service’s Computerized Delivery Sequence File. This Postal Service file has been estimated to cover 90% to 98% of the population.2 Within each sampled household, the adult with the next birthday is selected to participate. Other details of the ABS recruitment protocol have changed over time but are available upon request.3 Prior to 2018, the ATP was recruited using landline and cellphone random-digit-dial surveys administered in English and Spanish.
A national sample of U.S. adults has been recruited to the ATP approximately once per year since 2014. In some years, the recruitment has included additional efforts (known as an “oversample”) to improve the accuracy of data for underrepresented groups. For example, Hispanic adults, Black adults and Asian adults were oversampled in 2019, 2022 and 2023, respectively.
Sample design
The overall target population for this survey was noninstitutionalized persons ages 18 and older living in the United States. All active panel members were invited to participate in this wave.
Questionnaire development and testing
The questionnaire was developed by Pew Research Center in consultation with SSRS. The web program used for online respondents was rigorously tested on both PC and mobile devices by the SSRS project team and Pew Research Center researchers. The SSRS project team also populated test data that was analyzed in SPSS to ensure the logic and randomizations were working as intended before launching the survey.
Incentives
All respondents were offered a post-paid incentive for their participation. Respondents could choose to receive the post-paid incentive in the form of a check or gift code to Amazon.com, Target.com or Walmart.com. Incentive amounts ranged from $5 to $20 depending on whether the respondent belongs to a part of the population that is harder or easier to reach. Differential incentive amounts were designed to increase panel survey participation among groups that traditionally have low survey response propensities.
Data collection protocol
The data collection field period for this survey was May 26 to June 1, 2026. Surveys were conducted via self-administered web survey or by live telephone interviewing.
For panelists who take surveys online:4 Postcard notifications were mailed to a subset on May 26.5 Survey invitations were sent out in two separate launches: soft launch and full launch. Sixty panelists were included in the soft launch, which began with an initial invitation sent on May 26. All remaining English- and Spanish-speaking sampled online panelists were included in the full launch and were sent an invitation on May 27.
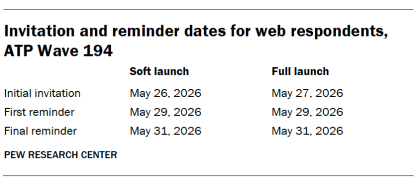
Panelists participating online were sent an email invitation and up to two email reminders if they did not respond to the survey. ATP panelists who consented to SMS messages were sent an SMS invitation with a link to the survey and up to two SMS reminders.
For panelists who take surveys over the phone with a live interviewer: Prenotification postcards were mailed on May 22. Soft launch took place on May 26 and involved dialing until a total of seven interviews had been completed. All remaining English- and Spanish-speaking sampled phone panelists’ numbers were dialed throughout the remaining field period. Panelists who take surveys via phone can receive up to six calls from trained SSRS interviewers.
Data quality checks
To ensure high-quality data, Center researchers performed data quality checks to identify any respondents showing patterns of satisficing. This includes checking for whether respondents left questions blank at very high rates or always selected the first or last answer presented. As a result of this checking, three ATP respondents were removed from the survey dataset prior to weighting and analysis.
Weighting
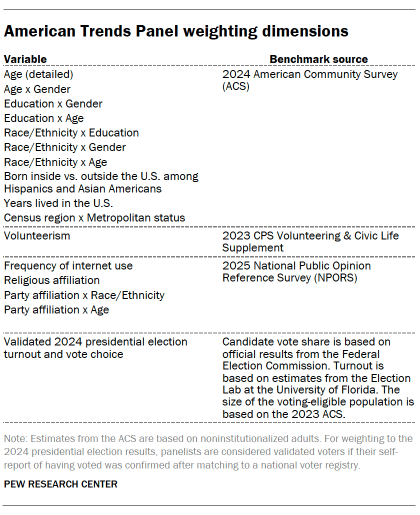
The ATP data is weighted in a process that accounts for multiple stages of sampling and nonresponse that occur at different points in the panel survey process. First, each panelist begins with a base weight that reflects their probability of recruitment into the panel. These weights are then calibrated to align with the population benchmarks in the accompanying table to correct for nonresponse to recruitment surveys and panel attrition. If only a subsample of panelists was invited to participate in the wave, this weight is adjusted to account for any differential probabilities of selection.
Among the panelists who completed the survey, this weight is then calibrated again to align with the population benchmarks identified in the accompanying table and trimmed at the 1st and 99th percentiles to reduce the loss in precision stemming from variance in the weights. Sampling errors and tests of statistical significance take into account the effect of weighting.
The following table shows the unweighted sample sizes and the error attributable to sampling that would be expected at the 95% level of confidence for different groups in the survey.
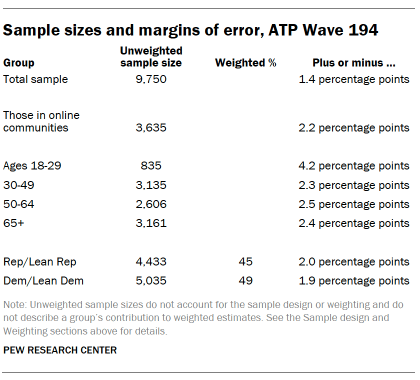
Sample sizes and sampling errors for other subgroups are available upon request. In addition to sampling error, one should bear in mind that question wording and practical difficulties in conducting surveys can introduce error or bias into the findings of opinion polls.
Dispositions and response rates
Open-end coding methodology
Open-ended responses to the question about the focus of people’s most-visited online community were coded using AI-assisted text classification. Human researchers reviewed, validated and, where necessary, corrected AI-generated codes prior to analysis. Center researchers developed a coding scheme using a model-assisted codebook development process that integrated human interpretation with unsupervised machine learning. First, researchers reviewed a randomly selected pilot sample of responses to independently identify key themes. In parallel, we used an unsupervised theme-discovery approach – based on sparse autoencoders and LLM-based interpretation – to generate candidate themes, using the HypotheSAEs method developed by Movva et al. (2025).6
This process included several steps:
- We converted each open-ended response into a numerical representation that captures its meaning, using an embedding model (OpenAI’s text-embedding-3-small).
- We then fit a sparse autoencoder to those representations – essentially training a model to describe every response using a limited set of features. The model ends up learning common themes corresponding to ideas that recur across many responses.
- We identified a list of the most common themes, examined the responses that exemplified each most strongly, and used a large language model (GPT-5.2) to summarize the common thread of the category.
- Researchers then reviewed and revised the set of candidate categories, combining researcher and LLM insights to create an initial codebook.
We gave the codebook to a large language model (GPT-5.2) alongside a prompt instructing the model to use it to code the open-ended responses with the category that most strongly applied or the first referenced if multiple were mentioned.
We validated the model’s performance against a sample of responses that researchers coded by hand. We drew a stratified sample of 210 responses to ensure that every category, including rare ones, was represented, supplemented by a set of randomly selected responses. Both the LLM and the human coders coded each response for the single best-fit label. Human coders worked from the same codebook and were not shown the automated codes. Agreement was measured using standard metrics for single-label classification. We also reviewed cases where the automated and human coding disagreed to understand these patterns and to inform revisions to the coding rules.
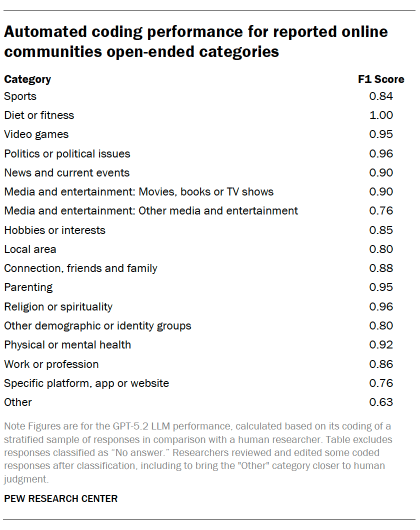
After minor adjustments to the codebook, the automated coding achieved a micro-averaged F1 score of 0.86.
Once validated, the LLM used the codebook to categorize all 3,635 responses. For each answer, the model followed a fixed procedure: The model read the response and selected exactly one code that fit the best; if multiple groups were mentioned in the response, it coded for the first one mentioned. The LLM only coded a response with the “Other” category if no other codable groups were present. It coded any blank, gibberish or nonsensical answers as “No answer.” A set of deterministic rules were applied afterward to enforce the codebook’s logic.
In this analysis, we classified 17 discrete categories for open-ended responses. The table below shows the F1 score for each of the individual categories.
Read the full prompt we used for this process.
Following the LLM’s classification, researchers conducted a review of the coded responses and made minor edits.
For more information on other ways the Center uses – and doesn’t use – AI, read about our AI policy.


