The American Trends Panel survey methodology
Overview
The American Trends Panel (ATP), created by Pew Research Center, is a nationally representative panel of randomly selected U.S. adults. Panelists participate via self-administered web surveys. Panelists who do not have internet access at home are provided with a tablet and wireless internet connection. Interviews are conducted in both English and Spanish. The panel is being managed by Ipsos.
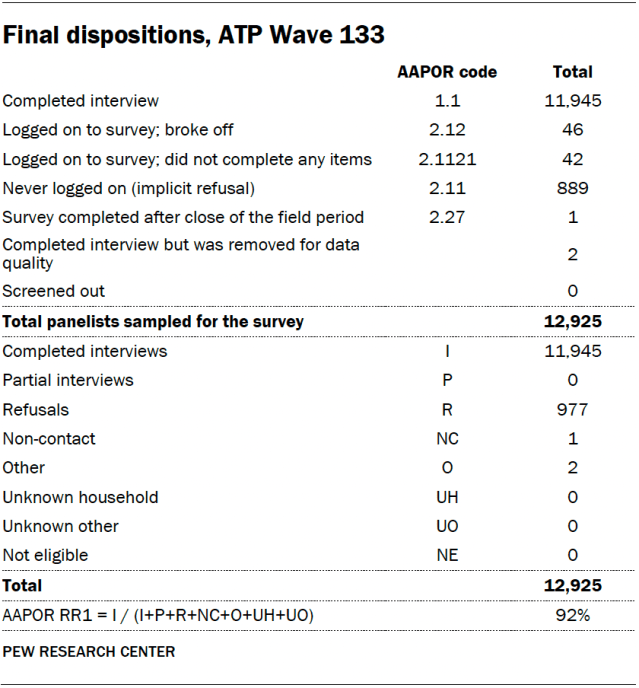
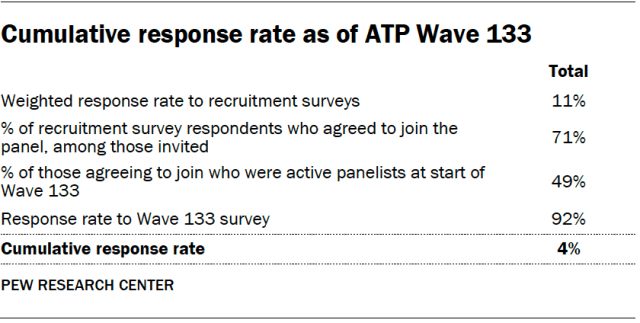
Data in this report is drawn from ATP Wave 133, conducted from Aug. 7 to Aug 27, 2023. A total of 11,945 panelists responded out of 12,925 who were sampled, for a response rate of 92%. The cumulative response rate accounting for nonresponse to the recruitment surveys and attrition is 4%. The break-off rate among panelists who logged on to the survey and completed at least one item is less than 1%. The margin of sampling error for the full sample of 11,945 respondents is plus or minus 1.4 percentage points.
Panel recruitment
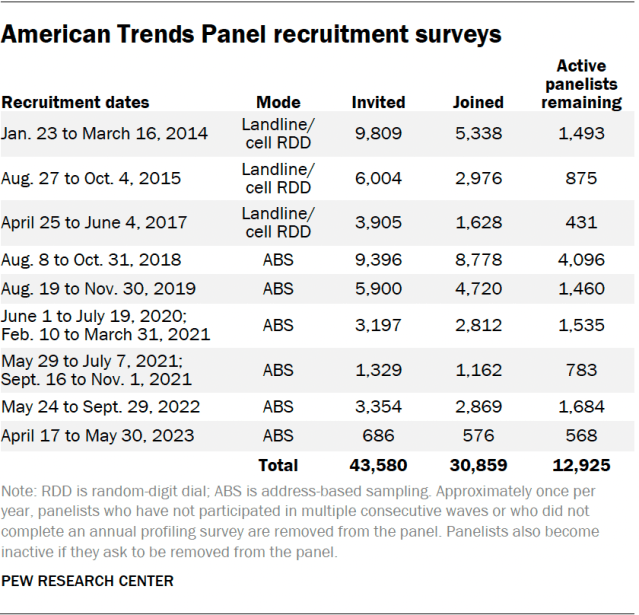
The ATP was created in 2014, with the first cohort of panelists invited to join the panel at the end of a large, national, landline and cellphone random-digit-dial survey that was conducted in both English and Spanish. Two additional recruitments were conducted using the same method in 2015 and 2017, respectively. Across these three surveys, a total of 19,718 adults were invited to join the ATP, of whom 9,942 (50%) agreed to participate.
In August 2018, the ATP switched from telephone to address-based sampling (ABS) recruitment. A study cover letter and a pre-incentive are mailed to a stratified, random sample of households selected from the U.S. Postal Service’s Delivery Sequence File. This Postal Service file has been estimated to cover as much as 98% of the population, although some studies suggest that the coverage could be in the low 90% range.2 Within each sampled household, the adult with the next birthday is asked to participate. Other details of the ABS recruitment protocol have changed over time but are available upon request.3
We have recruited a national sample of U.S. adults to the ATP approximately once per year since 2014. In some years, the recruitment has included additional effort (known as an “oversample”) to boost sample size with under-represented groups. For example, Hispanic adults, Black adults and Asian adults were oversampled in 2019, 2022 and 2023, respectively.
Across the six address-based recruitments, a total of 23,862 adults were invited to join the ATP, of whom 20,917 agreed to join the panel and completed an initial profile survey. Of the 30,859 individuals who have ever joined the ATP, 12,925 remained active panelists and continued to receive survey invitations at the time this survey was conducted.
The American Trends Panel never uses breakout routers or chains that direct respondents to additional surveys.
Sample design
The overall target population for this survey was noninstitutionalized persons ages 18 and older living in the U.S., including Alaska and Hawaii. All active panel members were invited to participate in this wave.
Questionnaire development and testing
The questionnaire was developed by Pew Research Center in consultation with Ipsos. The web program was rigorously tested on both PC and mobile devices by the Ipsos project management team and Pew Research Center researchers. The Ipsos project management team also populated test data that was analyzed in SPSS to ensure the logic and randomizations were working as intended before launching the survey.
Incentives
All respondents were offered a post-paid incentive for their participation. Respondents could choose to receive the post-paid incentive in the form of a check or a gift code to Amazon.com or could choose to decline the incentive. Incentive amounts ranged from $5 to $20 depending on whether the respondent belongs to a part of the population that is harder or easier to reach. Differential incentive amounts were designed to increase panel survey participation among groups that traditionally have low survey response propensities.
Data collection protocol
The data collection field period for this survey was Aug. 7 to Aug. 27, 2023. Postcard notifications were mailed to all ATP panelists with a known residential address on Aug. 7.
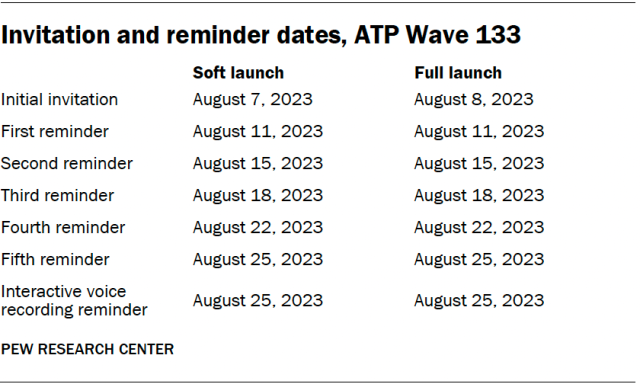
Invitations were sent out in two separate launches: soft launch and full launch. Ninety panelists were included in the soft launch, which began with an initial invitation sent on Aug. 7. The ATP panelists chosen for the initial soft launch were known responders who had completed previous ATP surveys within one day of receiving their invitation. All remaining English- and Spanish-speaking sampled panelists were included in the full launch and were sent an invitation on Aug. 8.
All panelists with an email address received an email invitation and up to five email reminders if they did not respond to the survey. All ATP panelists who consented to SMS messages received an SMS invitation and up to five SMS reminders. On Aug. 25, interactive voice recording reminder calls were made to 39 tablet households that previously provided consent to receive these reminders.
Data quality checks
To ensure high-quality data, the Center’s researchers performed data quality checks to identify any respondents showing clear patterns of satisficing. This includes checking for very high rates of leaving questions blank, as well as always selecting the first or last answer presented. As a result of this checking, two ATP respondents were removed from the survey dataset prior to weighting and analysis.
Weighting
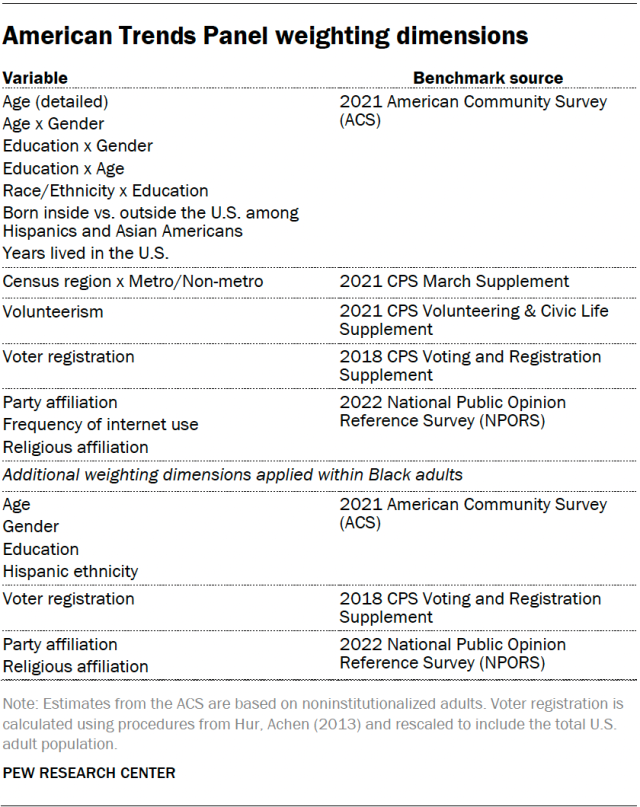
The ATP data is weighted in a multistep process that accounts for multiple stages of sampling and nonresponse that occur at different points in the survey process. First, each panelist begins with a base weight that reflects their probability of selection for their initial recruitment survey. These weights are then rescaled and adjusted to account for changes in the design of ATP recruitment surveys from year to year. Finally, the weights are calibrated to align with the population benchmarks in the accompanying table to correct for nonresponse to recruitment surveys and panel attrition. If only a subsample of panelists was invited to participate in the wave, this weight is adjusted to account for any differential probabilities of selection.
Among the panelists who completed the survey, this weight is then calibrated again to align with the population benchmarks identified in the accompanying table and trimmed at the 1st and 99.5th percentiles to reduce the loss in precision stemming from variance in the weights. Sampling errors and tests of statistical significance take into account the effect of weighting.
The following table shows the unweighted sample size and the error attributable to sampling that would be expected at the 95% level of confidence for different groups in the survey.
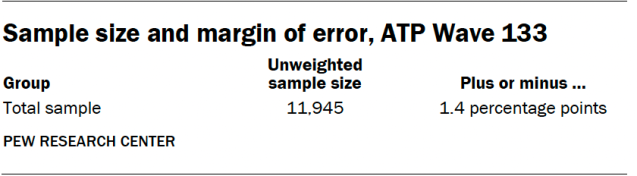
Sample sizes and sampling errors for other subgroups are available upon request. In addition to sampling error, one should bear in mind that question wording and practical difficulties in conducting surveys can introduce error or bias into the findings of opinion polls.
Dispositions and response rates
How family income tiers are calculated
Family income data reported in this study is adjusted for household size and cost-of-living differences by geography. Panelists then are assigned to income tiers that are based on the median adjusted family income of all American Trends Panel members. The process uses the following steps:
- First, panelists are assigned to the midpoint of the income range they selected in a family income question that was measured on either the most recent annual profile survey or, for newly recruited panelists, their recruitment survey. This provides an approximate income value that can be used in calculations for the adjustment.
- Next, these income values are adjusted for the cost of living in the geographic area where the panelist lives. This is calculated using price indexes published by the U.S. Bureau of Economic Analysis. These indexes, known as Regional Price Parities (RPP), compare the prices of goods and services across all U.S. metropolitan statistical areas as well as non-metro areas with the national average prices for the same goods and services. The most recent available data at the time of the annual profile survey is from 2021. Those who fall outside of metropolitan statistical areas are assigned the overall RPP for their state’s non-metropolitan area.
- Family incomes are further adjusted for the number of people in a household using the methodology from the Center’s previous work on the American middle class. This is done because a four-person household with an income of say, $50,000, faces a tighter budget constraint than a two-person household with the same income.
- Panelists are then assigned an income tier. “Middle-income” adults are in families with adjusted family incomes that are between two-thirds and double the median adjusted family income for the full ATP at the time of the most recent annual profile survey. The median adjusted family income for the panel is roughly $71,700. Using this median income, the middle-income range is about $47,800 to $143,400. Lower-income families have adjusted incomes less than $47,800 and upper-income families have adjusted incomes greater than $143,400 (all figures expressed in 2022 dollars and scaled to a household size of three). If a panelist did not provide their income and/or their household size, they are assigned “no answer” in the income tier variable.
Two examples of how a given area’s cost-of-living adjustment was calculated are as follows: The Anniston-Oxford metropolitan area in Alabama is a relatively inexpensive area, with a price level that is 16.2% less than the national average. The San Francisco-Oakland-Berkeley metropolitan area in California is one of the most expensive areas, with a price level that is 19.8% higher than the national average. Income in the sample is adjusted to make up for this difference. As a result, a family with an income of $41,900 in the Anniston-Oxford area is as well off financially as a family of the same size with an income of $59,900 in San Francisco.