
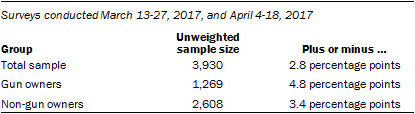
Surveys conducted March 13-27, 2017, and April 4-18, 2017
The American Trends Panel (ATP), created by the Pew Research Center, is a nationally representative panel of randomly selected U.S. adults recruited from landline and cellphone random-digit dial (RDD) surveys. Panelists participate via monthly self-administered web surveys. Panelists who do not have internet access are provided with a tablet and wireless internet connection. The panel is being managed by Abt Associates.
Most of the data in this report are based on 3,930 respondents who participated in both the March 13 to 27, 2017, and April 4 to 18, 2017, waves of the panel. The margin of sampling error for the full sample of 3,930 respondents is plus or minus 2.8 percentage points.
Members of the American Trends Panel were recruited from two large, national landline and cellphone random-digit dial surveys conducted in English and Spanish. At the end of each survey, respondents were invited to join the panel. The first group of panelists was recruited from the 2014 Political Polarization and Typology Survey, conducted January 23 to March 16, 2014. Of the 10,013 adults interviewed, 9,809 were invited to take part in the panel and a total of 5,338 agreed to participate.4 The second group of panelists was recruited from the 2015 Survey on Government, conducted Aug. 27 to Oct. 4, 2015. Of the 6,004 adults interviewed, all were invited to join the panel, and 2,976 agreed to participate.5
The ATP data were weighted in a multistep process that begins with a base weight incorporating the respondents’ original survey selection probability and the fact that in 2014 some panelists were subsampled for invitation to the panel. Next, an adjustment was made for the fact that the propensity to join the panel and remain an active panelist varied across different groups in the sample. The final step in the weighting uses an iterative technique that aligns the sample to population benchmarks on a number of dimensions. Gender, age, education, race, Hispanic origin and region parameters come from the U.S. Census Bureau’s 2015 American Community Survey. The county-level population density parameter (deciles) comes from the 2010 U.S. decennial census. The telephone service benchmark is comes from the January-June 2016 National Health Interview Survey and is projected to 2017. The volunteerism benchmark comes from the 2015 Current Population Survey Volunteer Supplement. The party affiliation benchmark is the average of the three most recent Pew Research Center general public telephone surveys. The internet access benchmark comes from the 2015 Pew Research Center Survey on Government. Respondents who did not previously have internet access are treated as not having internet access for weighting purposes. Sampling errors and statistical tests of significance take into account the effect of weighting. Interviews are conducted in both English and Spanish, but the Hispanic sample in the American Trends Panel is predominantly native born and English speaking.
The following table shows the unweighted sample sizes and the error attributable to sampling that would be expected at the 95% level of confidence for different groups in the survey:
Sample sizes and sampling errors for other subgroups are available upon request.
In addition to sampling error, one should bear in mind that question wording and practical difficulties in conducting surveys can introduce error or bias into the findings of opinion polls.
The combined two waves had a response rate of 76% (3,930 responses among 5,155 individuals in the panel). Taking account of the combined, weighted response rate for the recruitment surveys (10.0%) and attrition from panel members who were removed at their request or for inactivity, the cumulative response rate for the combined two ATP waves is 2.6%.6
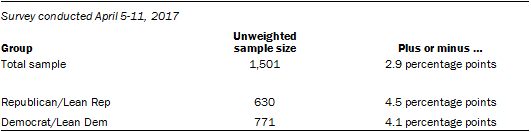
Survey conducted April 5-11, 2017
Some of the analysis in this report is based on telephone interviews conducted April 5 to 11, 2017, among a national sample of 1,501 adults, 18 years of age or older, living in all 50 U.S. states and the District of Columbia (375 respondents were interviewed on a landline telephone, and 1,126 were interviewed on a cellphone, including 693 who had no landline telephone). The survey was conducted by interviewers at Princeton Data Source under the direction of Princeton Survey Research Associates International. A combination of landline and cellphone random-digit dial samples were used; both samples were provided by Survey Sampling International. Interviews were conducted in English and Spanish. Respondents in the landline sample were selected by randomly asking for the youngest adult male or female who is now at home. Interviews in the cell sample were conducted with the person who answered the phone, if that person was an adult 18 years of age or older. For detailed information about our survey methodology, see https://www.pewresearch.org/methodology/u-s-survey-research/
The combined landline and cellphone samples are weighted using an iterative technique that matches gender, age, education, race, Hispanic origin and nativity, and region to parameters from the 2015 Census Bureau’s American Community Survey and population density to parameters from the decennial census. The sample also is weighted to match current patterns of telephone status (landline only, cellphone only, or both landline and cellphone), based on extrapolations from the 2016 National Health Interview Survey. The weighting procedure also accounts for the fact that respondents with both landline and cellphones have a greater probability of being included in the combined sample and adjusts for household size among respondents with a landline phone. The margins of error reported and statistical tests of significance are adjusted to account for the survey’s design effect, a measure of how much efficiency is lost from the weighting procedures.
The following table shows the unweighted sample sizes and the error attributable to sampling that would be expected at the 95% level of confidence for different groups in the survey:
Sample sizes and sampling errors for other subgroups are available upon request.
In addition to sampling error, one should bear in mind that question wording and practical difficulties in conducting surveys can introduce error or bias into the findings of opinion polls.
Pew Research Center undertakes all polling activity, including calls to mobile telephone numbers, in compliance with the Telephone Consumer Protection Act and other applicable laws.
Community type coding
Data
Data for each census tract were obtained from the Census Bureau. Tract population was taken from American FactFinder, table ID B01003 (“Total Population”), 2015 ACS five-year estimates. Land area for each tract was taken from the 2015 U.S. Gazetteer files. Population density in people per square mile is calculated as follows:
population density = population/(land area)
The share of the tract population living in a census-designated rural place is calculated from American FactFinder, table ID P2 (“Urban and Rural”), 2010 census SF1 100% data. Since the Census Bureau’s urban and rural definitions are complete and opposites (i.e. the shares living in rural and urban areas add to 100%), only the share living in a rural area is kept in the dataset. This information was last calculated after the 2010 decennial census. Besides being slightly outdated, these data do not reflect changes to census tracts since 2010. This issue affects only a small number of tracts.
Metropolitan area status in 2015 is based on the Office of Management and Budget (OMB) definitions and available from the Census Bureau. Metropolitan areas are determined at the county level. In order to match tracts with counties, the first five digits of the tract ID code (which correspond to the county FIPS codes) are used.
To merge individual census tracts to American Trends Panelists, longitude and latitude were geocoded based on address provided by the panelist. An 81% majority of respondents to waves 25 and 26 of the panel were able to be matched to their census tract using this method.
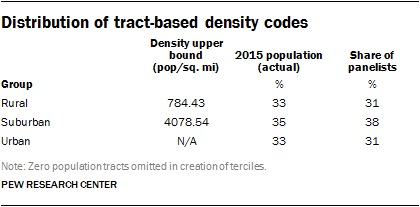
Calculating density groupings
First, the tracts are ordered by population density, least dense to most dense. All tracts with no population are discarded for the purposes of calculating the percentile breaks.
Upper bound population densities are provided for the breaks in the table below. These values correspond to respective percentile rankings. For example, the upper bound of the first tercile, 784.43 people/sq. mile, is the 33rd percentile of the data.
Respondents who did not provide an address and therefore were not able to be geocoded (19% of respondents to waves 25 and 26 of the panel) were instead assigned a community designation based on the location of their telephone number or provided ZIP code in a community of a specific size. For landline numbers, urban/suburban/rural designations are based on OMB definitions and are appended to each number in the sample by the survey sample vendor. OMB defines an urban area as the central portion of a metropolitan statistical area (MSA) while suburban is non-central portions of the MSA and rural encompasses all areas of the country that are not within an MSA. For cellphone numbers, respondents are asked the ZIP code in which they live and then those cellphone respondents are matched to known community type designations based on landlines in the same ZIP code.
Pew Research Center is a nonprofit, tax-exempt 501(c)(3) organization and a subsidiary of The Pew Charitable Trusts, its primary funder.
© Pew Research Center, 2017


