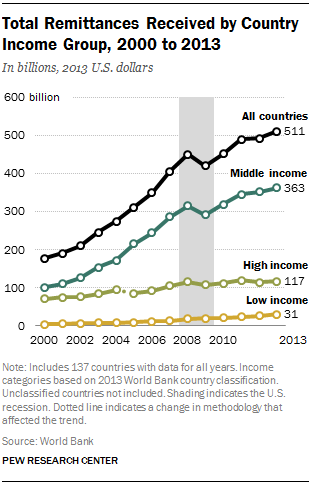
Remittances worldwide have nearly tripled since 2000 and experienced only a one-year dip during the recent recession. Remittances to middle-income countries—the birthplace of a rising share of immigrants worldwide—have more than tripled since 2000, and middle-income nations account for a markedly increased share of all remittances over that period.
After a one-year decline in 2009 during the Great Recession, remittances worldwide recovered the following year and have continued to rise. Remittances to all nations declined 7% ($30 billion) in 2009, to $420 billion, but by 2010 were slightly higher ($452 billion) than they had been in 2008 ($450 billion).
For those countries with available data, remittances rose 22% from 2009 to 2013, according to World Bank data. (The analysis in this chapter is based on remittances to 137 nations that receive 93% of estimated 2013 remittances in World Bank data. See Appendix A: Methodology for details.)
In 2013, the world’s middle-income nations as a group received an estimated $363 billion in remittances, according to World Bank data. That represented growth of 360% since 2000. As with remittances overall, remittances to middle-income countries declined in 2009 but picked up the following year to exceed the 2008 total. From 2009 to 2013, remittances to middle-income nations grew by 24%.
From 2000 to 2013, remittances to high-income nations as a group grew 64% and to low-income nations increased more than sixfold.5 Remittances to high-income nations declined during the recession, but remittances to low-income nations did not.
Remittances to high-income nations declined in 2009, rose in 2010 and by 2011 exceeded the total for 2008. Remittances to low-income nations have risen each year since 2000.
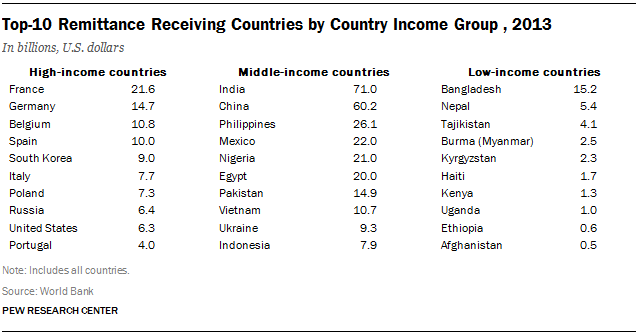
By any measure, India and China are the top global recipients of remittances, according to World Bank data. They also are the top receiving nations among middle-income countries. In 2013, India received an estimated $71 billion in remittances, and China an estimated $60 billion. Among the other top middle-income receiving nations for remittances are the Philippines ($26 billion), Mexico ($22 billion) and Nigeria ($21 billion).
Among high-income nations, the top five remittance receivers are France (with an estimated $22 billion in 2013), Germany ($15 billion), Belgium ($11 billion), Spain ($10 billion) and South Korea ($9 billion). The United States, which received an estimated $6 billion in remittances in 2013, ranks ninth among high-income nations.

Among the world’s poorest countries, Bangladesh ranks first as a remittance receiving nation, taking in $15 billion in 2013, according to World Bank estimates. Among the other top low-income receiving nations are Nepal ($5 billion), Tajikistan ($4 billion), Burma (Myanmar) ($3 billion) and Kyrgyzstan ($2 billion).
Share of Remittances by Income Category

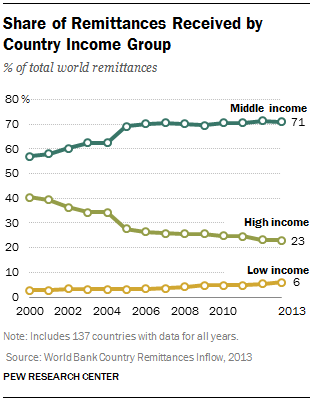
Middle-income nations receive the majority of remittances worldwide, 71% in 2013, according to World Bank estimates. Their share of the total has grown markedly since 2000, when it was 57%. That growth has slowed since the mid-2000s; middle-income nations have claimed 70% to 71% of the total since 2006.
Low-income nations receive a small share of remittances worldwide, an estimated 6% in 2013, but that share has doubled since 2000. The growth in share of remittances to these nations has taken place since 2006.
High-income nations receive 23% of worldwide remittances, according to World Bank 2013 estimates. That share has declined from 40% in 2000. Most of the decline came before the mid-2000s.
Remittances as Share of GDP

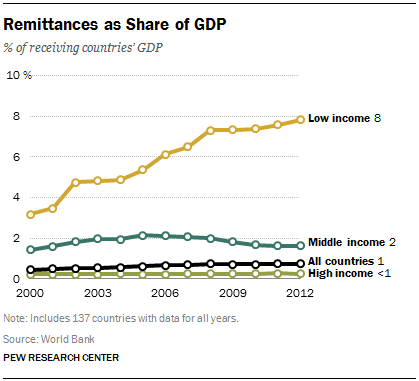
Remittances represent a higher share of GDP in poorer nations than in richer ones and also have grown more sharply as a share of GDP. Among all low-income nations, remittances accounted for an estimated 8% of GDP in 2012. The contribution of remittances to the GDP of low-income nations overall has more than doubled since 2000, when money sent home by migrants represented about 3% of those countries’ GDP. These nations, however, receive a small share of all world remittances.
Among middle-income nations, remittances represented less than 2% of GDP in 2012, according to an analysis of World Bank estimates.
Meanwhile, among high-income nations, remittances are a much smaller share of 2012 GDP, less than 1%, according to an analysis of World Bank estimates.


