
Adjusted for inflation,8 the median wealth, or net worth, of U.S. households fell from $96,894 in 2005 to $70,000 in 2009, a drop of 28%. The precipitous decline in wealth was not evenly distributed across groups. Minority households—Hispanics, blacks and Asians—experienced far steeper declines than white households.
Minority households experienced greater losses because they are more dependent on home equity as a source of wealth. As noted above, housing values started to fall sooner than stock prices and, unlike the stock market, the housing market has not begun to recover. Hispanics and Asians were further affected because they are disproportionately likely to reside in states that have been among the hardest hit by the housing crisis: California, Florida, Nevada and Arizona. Hispanics and blacks have also been more susceptible to home foreclosures and their homeownership rates have dropped more than for any other group.
Household Wealth by Race and Ethnicity
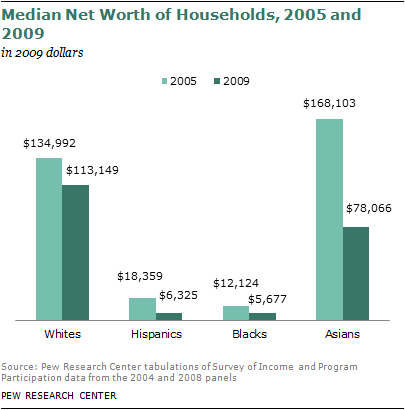
In 2009, the median net worth of white households—$113,149—was the highest of all groups. In sharp contrast, Hispanic and black households had median net worth of $6,325 and $5,677 respectively. Asian households, with a median net worth of $78,066, had much more wealth in 2009 than Hispanics and blacks but much less than whites.
All groups experienced drops in wealth from 2005 to 2009 but there were sharp differences among them. Hispanics’ median net worth fell 66%, from $18,359 in 2005 to $6,325 in 2009. Black households experienced a loss of 53%, from $12,124 in 2005 to $5,677 in 2009. The drop in the wealth of white households was modest in comparison, falling 16% from $134,992 in 2005 to $113,149 in 2009.
Asian households lost their standing at the top of the wealth ranking. Their net worth is estimated to have fallen by 54%, from $168,103 in 2005 to $78,066 in 2009.
However, as discussed in greater detail in the appendix, the recorded decrease in the wealth of Asian households, more than three-quarters of which are headed by immigrants, is sensitive to the arrival of new immigrants between 2005 and 2009. The accumulation of assets takes time, and immigrants initially tend to have low levels of wealth.9 If the 2009 SIPP sample is adjusted to remove immigrants who arrived since 2004, the median wealth of Asian households in 2009 is estimated to be $116,555. That is a drop of 31% from 2005, nearly twice as much as for white households but still leaving Asian households with median wealth that is similar to that of whites.10
The Gap in Wealth between Whites, Hispanics and Blacks
In 2009, the median wealth of white households was 20 times as high as the wealth of black households and 18 times as much as the wealth of Hispanic households. These ratios are about twice as high as the ratios that existed before the onset of the housing crisis, the stock market crash and the Great Recession. In 2005, the median wealth of white households was 11 times the wealth of black households and seven times the wealth of Hispanic households. The wealth gaps that currently exist between whites, Hispanics and blacks are the highest in at least 25 years.11
The Role of Housing
An owned home is the most important asset in the portfolio of most households.12 Thus, the housing downturn that began in 2006 had a great impact on the net worth of a typical household.
Overall, the net worth of the typical U.S. household decreased from $96,894 in 2005 to $70,000 in 2009, a loss of $26,894. However, median net worth in assets other than home equity fell by only $3,522, from $17,088 in 2005 to $13, 566 in 2009. These estimates suggest that the total loss in net worth emanated principally from declining levels of home equity.13
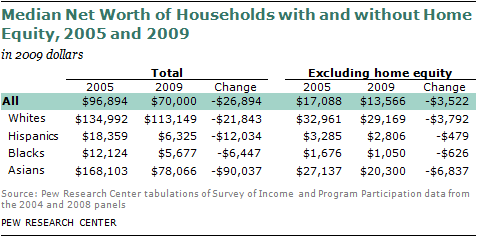
The corrosive effect of the housing downturn was the deepest for Hispanics and blacks. Median net worth exclusive of home equity decreased only $479 for Hispanics and $626 for blacks. With housing included, their losses were $12,034 and $6,447, respectively. Similarly, white and Asian households would have experienced only a small fraction of their actual losses if not for the housing downturn.
Households with Zero or Negative Net Worth
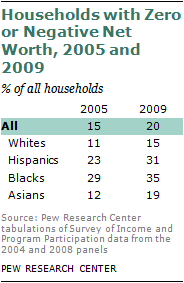
A significant fraction of U.S. households either have no wealth (zero net worth) or have more liabilities than assets (negative net worth). Overall, 20% of U.S. households were in this position in 2009, up from 15% in 2005. The share of households with zero or negative net worth is much higher among Hispanics and blacks. About one-third of Hispanics (31%) and blacks (35%) had no wealth or were in debt in 2009, compared with 15% of whites.
The increase in the share of households with zero or negative net worth from 2005 to 2009 was greatest among minority households. It increased from 23% to 31% for Hispanics, from 12% to 19% for Asians, and from 29% to 35% for blacks. The change was more modest for white households, with the share climbing from 11% to 15%. Thus, another gulf, the one separating those with some wealth from those without, has widened, to the disadvantage of minority households.


