Prediction markets saw $2.7 billion in trading related to this year’s midterm elections in the United States, according to a Pew Research Center analysis of data from The Block, a digital assets media and information firm.
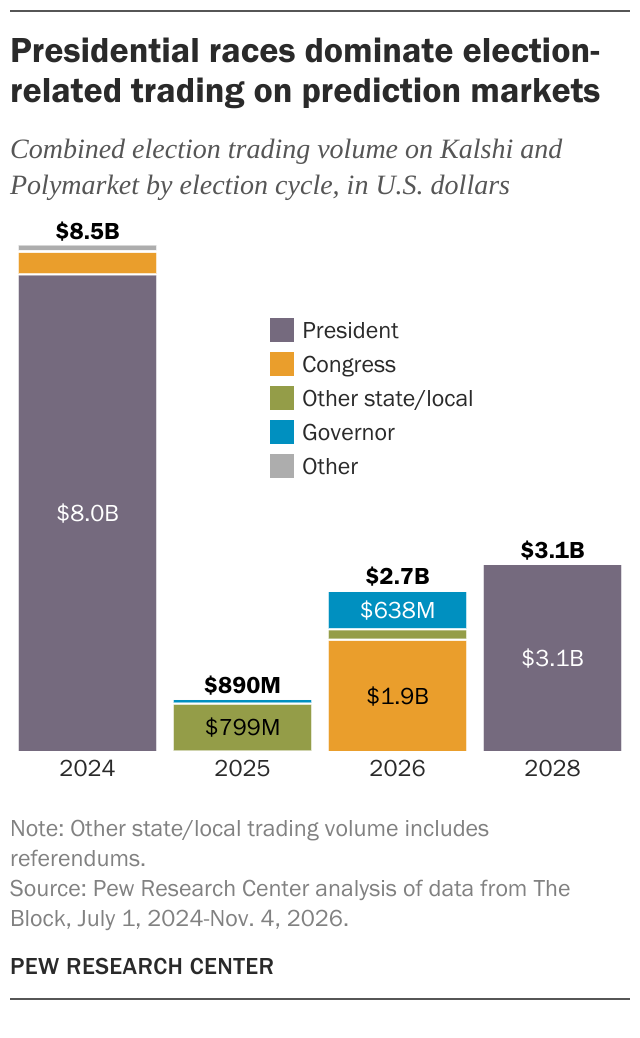
| Office | Congress | Governor | Other | President | Other state/local | Total |
|---|---|---|---|---|---|---|
| 2024 | 379,350,641 | 4,374,370 | 109,715,663 | 7,962,133,368 | 2,251,039 | 8,457,825,082 |
| 2025 | 9,699,483 | 76,144,420 | 5,284,477 | 0 | 798,752,760 | 889,881,141 |
| 2026 | 1,872,436,491 | 638,327,807 | 6,906,717 | 0 | 174,058,383 | 2,691,729,399 |
| 2028 | 470,483 | 51,314 | 15,412 | 3,138,465,449 | 7,430 | 3,139,010,088 |
Trading volume on this year’s elections pales in comparison to the $8.5 billion traded on the 2024 elections, the majority of which was on the presidential race. It’s also below the amount traded so far on the upcoming 2028 presidential election. Questions like who will win each party’s nomination and which candidate will win the general election in 2028 have already drawn $3 billion in trading volume.
The two major prediction markets included in this analysis, Kalshi and Polymarket, have promoted their election event contracts as tools for accurately forecasting the races. They’ve also reported that many users visit their sites for information without placing trades. Some news sites have used prediction market odds in their election reporting.
Critics of election-related trading have raised concerns about election integrity, including insider trading and manipulating the odds on low-volume markets. More than half of states restrict betting on elections, but prediction markets are not currently regulated as gambling operators.
How has election-related trading evolved in recent years?
In 2024, nearly all election-related trading was focused on the presidential election. The markets on whether Donald Trump or Kamala Harris would win the election still rank as two of the three highest-volume markets of all time, political or otherwise, on both Kalshi and Polymarket. (On Kalshi, the first is related to who would win the 2026 FIFA World Cup.)
In 2025, off-cycle trading was similarly dominated by a single campaign: the New York City mayoral election. Three-quarters of election trading volume in 2025 pertained to that race, with more than a quarter of it spent on markets that mentioned Zohran Mamdani, the winning candidate, by name.
In 2026, trading volume was more dispersed across a range of races: 70% of trading volume focused on control of Congress or individual congressional elections, and nearly a quarter was devoted to gubernatorial elections. Other state and local races made up the rest.
Which races were traded most heavily in 2026?
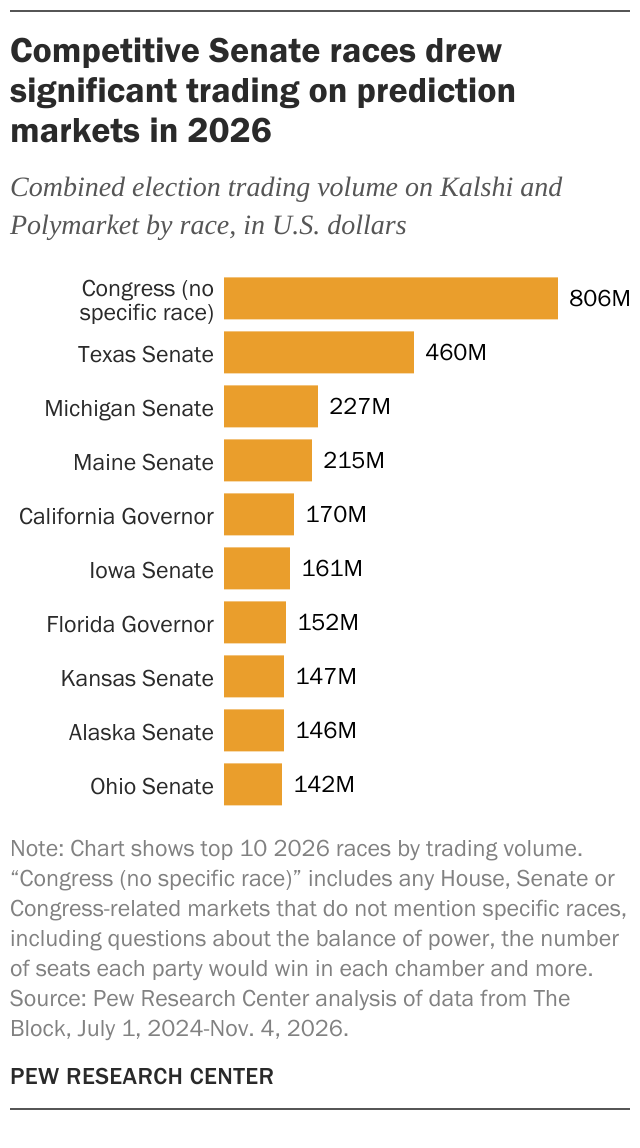
| Race | Volume (in millions) |
|---|---|
| Congress (no specific race) | 806 |
| Texas Senate | 460 |
| Michigan Senate | 227 |
| Maine Senate | 215 |
| California Governor | 170 |
| Iowa Senate | 161 |
| Florida Governor | 152 |
| Kansas Senate | 147 |
| Alaska Senate | 146 |
| Ohio Senate | 142 |
In 2026, two-thirds of election trading volume was on markets that mentioned individual states, up from just 15% in 2024.
Statewide races for Senate and governor are usually the marquee elections in midterm years. Many of the races with the highest trading volume this year were high-profile, competitive Senate contests like those in Texas, Michigan and Maine.
Notably, 42% of total election-related trading volume in 2026 — over $1 billion — was on races in states where election betting is illegal in at least some instances. Some states warned voters that prediction markets’ election contracts violate those laws.
How many election-related markets existed in 2026?
Although the amount of money traded on election markets was lower this year than in 2024, the number of markets available to trade was far higher. In 2026, users traded on around 34,000 election-related markets on Kalshi and Polymarket, up from about 2,300 in 2024.
Many of the markets related to the 2026 midterms were “thinly traded” – that is, low-volume ones where relatively small amounts of money could meaningfully change the odds. Nearly half of all election markets in 2026 had less than $1,000 in trading volume, compared with just 4% in 2024.
Conversely, a small number of popular markets saw the vast majority of trading volume in 2026. Some 90% of election-related trading volume in 2026 went to 1,087 markets – only around 3% of the total number of available markets.
Markets with no trading volume are excluded from all calculations in this section, such as the number and share of available markets.
How does political trading differ between Kalshi and Polymarket?
Politics makes up a relatively small share of overall trading volume on Kalshi and Polymarket, which have come to be dominated by sports.
While both platforms saw a marked increase in political trading the week of the midterms, politics remains a much higher-volume trading topic on Polymarket than on Kalshi.
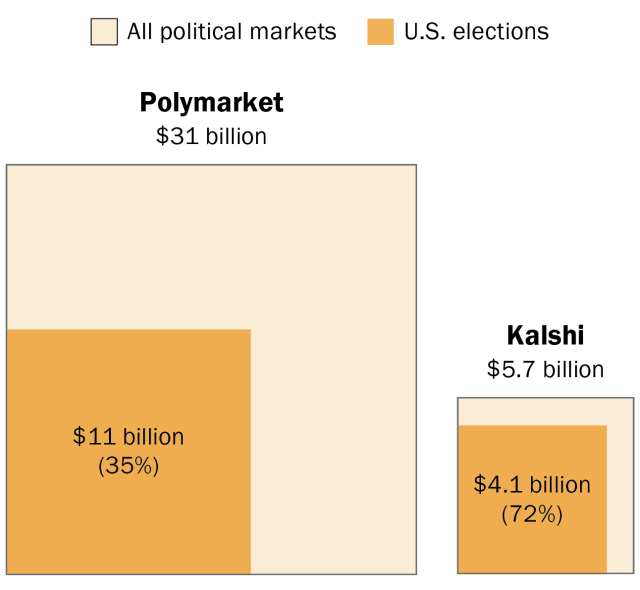
| Platform | Total political trading volume | U.S. election trading volume | U.S. election share |
|---|---|---|---|
| Kalshi | 5.7 billion | 4.1 billion | 72% |
| Polymarket | 31 billion | 11 billion | 35% |
The two platforms also differ in the type of political questions that traders focus on:
- On Kalshi, 72% of political trading since 2024 has been related to U.S. elections. The rest pertained to elections outside the U.S. or other political topics like legislative developments or the behavior of elected officials.
- On Polymarket, those other questions dominate. Just 35% of political trading volume since 2024 was related to U.S. elections.