Note: This is an update of an analysis originally published on Nov. 6, 2026.
The most common question pollsters hear around election time is “Who’s going to win?” A close second this year was “Are the polls going to be wrong again?”
With vote counting nearly complete in most states, two conclusions seem clear: Preelection polls captured the direction of this year’s election while generally understating the size of Democrats’ advantage.
Polls consistently documented the electorate’s dark mood this year, including deep dissatisfaction with President Donald Trump, even among some of his 2024 voters. That frustration was particularly focused on his economic policies.
Polls also consistently identified a wide enthusiasm gap, with Democratic supporters more interested, engaged and likely to show up to vote than Republican supporters. Indeed, Democratic supporters were also more likely to take preelection surveys, as a number of our colleagues reported.
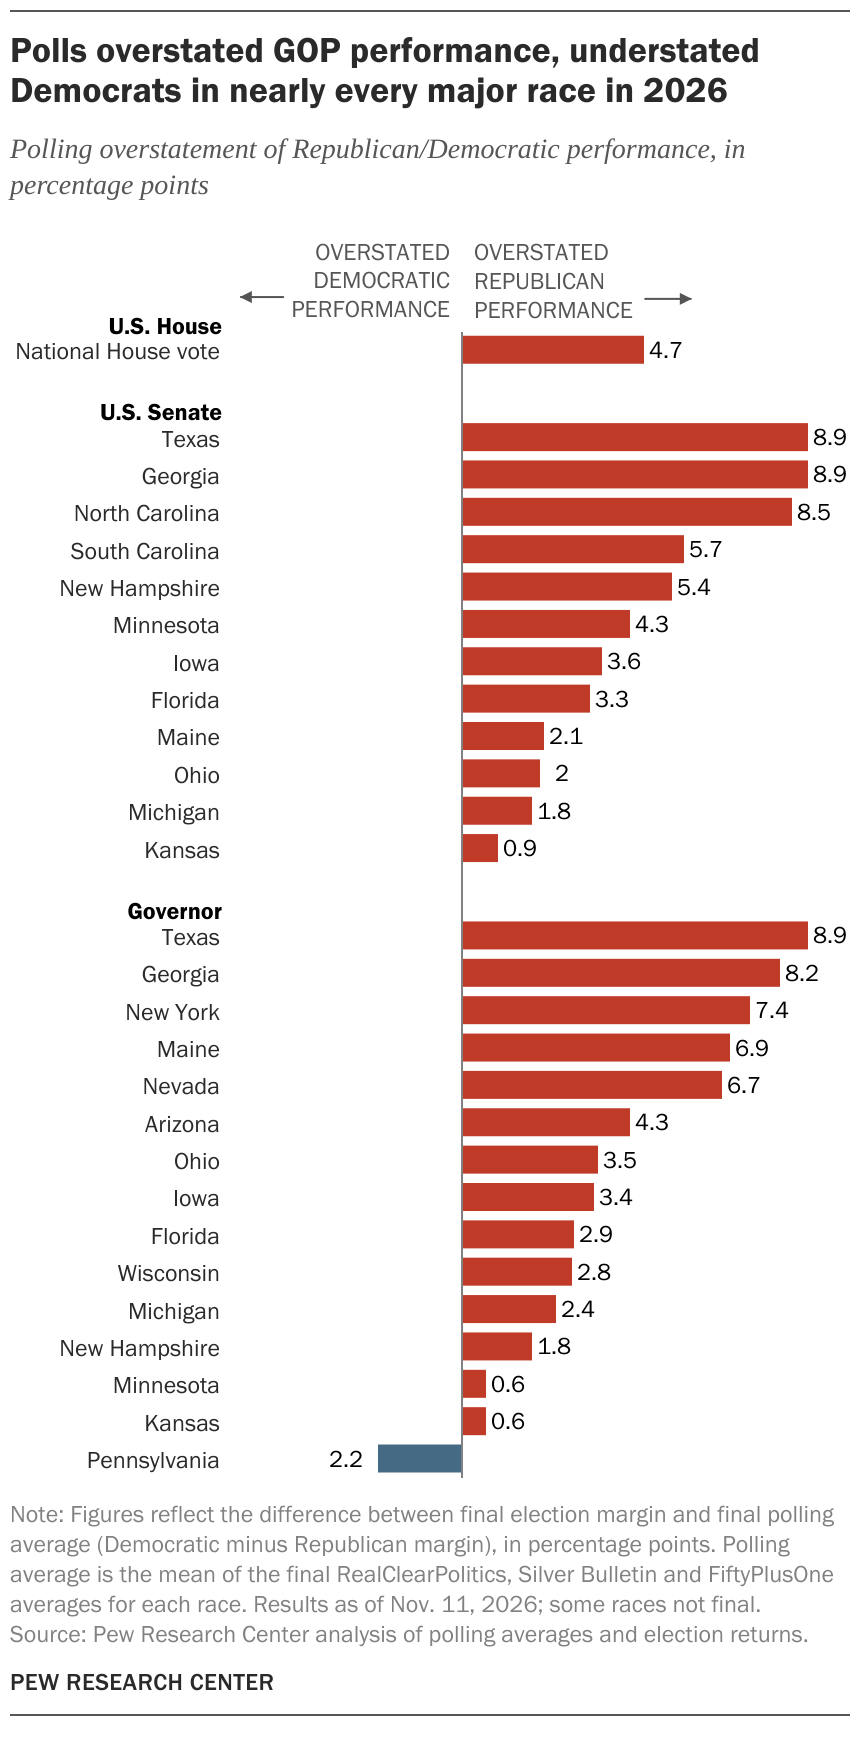
In the end, polls found more than enough opportunities for Democratic pickups in the Senate to win a majority in the chamber, and they indicated a likely Democratic takeover of the U.S. House of Representatives. But the polling understated the size of the eventual Democratic victory in many of the major statewide races (Texas and Georgia, in particular), as well as in the overall House vote.
How polls performed in key statewide races
| Race | Office | Direction | Error |
|---|---|---|---|
| National House vote | U.S. House | Polls understated Dem margin | 4.7 |
| Texas | U.S. Senate | Polls understated Dem margin | 8.9 |
| Georgia | U.S. Senate | Polls understated Dem margin | 8.9 |
| North Carolina | U.S. Senate | Polls understated Dem margin | 8.5 |
| South Carolina | U.S. Senate | Polls understated Dem margin | 5.7 |
| New Hampshire | U.S. Senate | Polls understated Dem margin | 5.4 |
| Minnesota | U.S. Senate | Polls understated Dem margin | 4.3 |
| Iowa | U.S. Senate | Polls understated Dem margin | 3.6 |
| Florida | U.S. Senate | Polls understated Dem margin | 3.3 |
| Maine | U.S. Senate | Polls understated Dem margin | 2.1 |
| Ohio | U.S. Senate | Polls understated Dem margin | 2.0 |
| Michigan | U.S. Senate | Polls understated Dem margin | 1.8 |
| Kansas | U.S. Senate | Polls understated Dem margin | 0.9 |
| Texas | Governor | Polls understated Dem margin | 8.9 |
| Georgia | Governor | Polls understated Dem margin | 8.2 |
| New York | Governor | Polls understated Dem margin | 7.4 |
| Maine | Governor | Polls understated Dem margin | 6.9 |
| Nevada | Governor | Polls understated Dem margin | 6.7 |
| Arizona | Governor | Polls understated Dem margin | 4.3 |
| Ohio | Governor | Polls understated Dem margin | 3.5 |
| Iowa | Governor | Polls understated Dem margin | 3.4 |
| Florida | Governor | Polls understated Dem margin | 2.9 |
| Wisconsin | Governor | Polls understated Dem margin | 2.8 |
| Michigan | Governor | Polls understated Dem margin | 2.4 |
| New Hampshire | Governor | Polls understated Dem margin | 1.8 |
| Minnesota | Governor | Polls understated Dem margin | 0.6 |
| Kansas | Governor | Polls understated Dem margin | 0.6 |
| Pennsylvania | Governor | Polls overstated Dem margin | -2.2 |
In fact, preelection polling estimates understated the Democratic margin by at least 2 percentage points in 21 of 27 races for governor and U.S. Senate with available data at the time of this writing. The mean understatement across all 27 races was about 4 points.
But there was a lot of variability. Underestimates ranged from 8 to 9 points in the Senate and gubernatorial races in Texas and Georgia, as well as the North Carolina Senate race. They were a little less than 1 point in two statewide races in Kansas and the Minnesota’s governor race. (The Alaska Senate race is not included in this analysis because vote counting is far from complete. But the eventual polling error there is likely to be small.)
Polls in Pennsylvania overstated the Democratic margin in the governor’s race by a little more than 2 points. Incumbent Gov. Josh Shapiro still won reelection by about 22 points.
How polls performed in the House vote
Many pollsters provide what’s known as the “generic House ballot,” which asks voters which party’s candidate they intend to support in their local House race. Since many House races are uncompetitive, this measure is more valuable as an indicator of partisan sentiment than as a precise predictor of how many seats a party will win. But it’s still possible to compare the total number of Republican and Democratic votes cast with preelection polling estimates.
On the generic House ballot, the Democratic advantage in polls was nearly 9 percentage points, according to the RealClearPolitics polling average. As of Nov. 11, the combined House vote showed a Democratic lead of a little less than 14 points, yielding a polling error of a little less than 5 points.
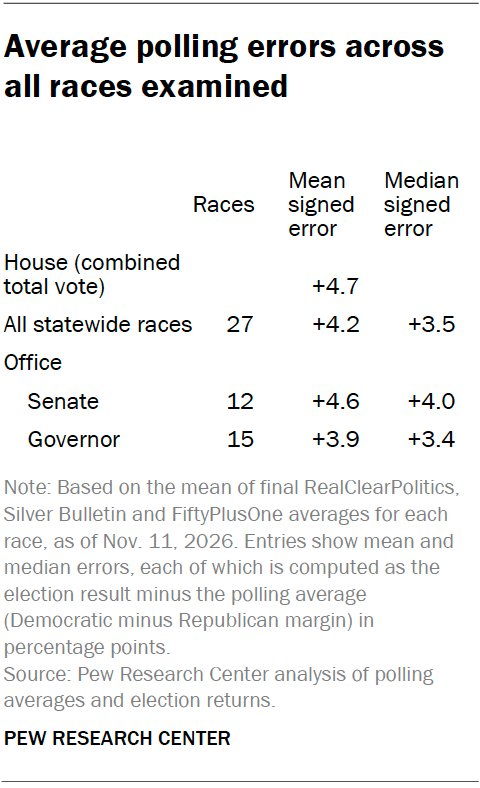
If the average error across all types of races ends up around 4 to 5 points, it would be larger than the error for similar races in the midterm elections of 2022 and 2018, as documented by the American Association for Public Opinion Research.
An average error of this size would be a little larger than the state polling errors in the presidential and Senate contests in 2024, and on par with errors in the governors’ races that year. It would be roughly in line with state-level presidential polling errors in 2020, when surveys overstated Joe Biden’s margin by about the same amount.
What’s behind the understatement of Democratic candidates?
It’s way too early to identify the source or sources of these errors. It takes time to compile critical data on who actually turned out to vote.
Panel surveys and turnout data will give us a better understanding of how much of the outcome was due to changes in vote choice versus changes in who turned out – and whether preelection polling adequately captured both of these dynamics.
Pollsters have worked hard over the past several election cycles to ensure that Republican voters are adequately represented in their samples. Adjustments based on party affiliation or past vote can improve accuracy, but their effectiveness depends on how these adjustments are made. One question for further analysis is whether weighting procedures and likely voter models adequately allowed for differences between the 2024 and 2026 electorates. (It also bears mentioning that 2026 brought several unique challenges for election polling.)
Preelection polling this year accurately depicted the public’s dissatisfaction with national conditions and where Americans placed the blame. It revealed that Democrats were highly motivated to vote, as well as dissatisfaction among parts of Trump’s 2024 electoral coalition. In the coming weeks and months, further analysis will help us better understand why the election unfolded the way it did and hopefully reveal why polling understated the forces that brought Democrats back into power in Congress and in many states.