

May is Asian/Pacific American Heritage Month, which recognizes Asian Americans, Native Hawaiians and Pacific Islanders in the United States.
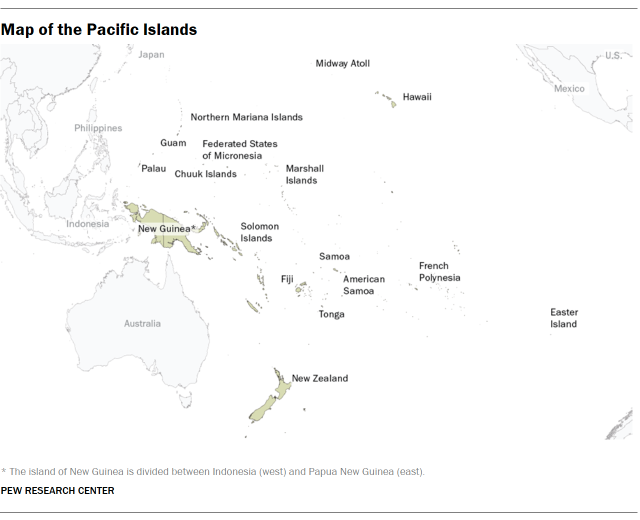
About 1.7 million people in the U.S. are Native Hawaiian or Pacific Islander (NHPI), tracing their roots to Hawaii, Guam, Samoa or other Pacific Islands in Oceania. They make up 0.5% of all Americans and encompass a wide range of cultures, histories and communities.
A note on the data
This analysis primarily uses the U.S. Census Bureau’s 2024 American Community Survey (ACS). The ACS collects information about people living in the 50 U.S. states and the District of Columbia. It does not cover people living in U.S. territories.
Information about people living in the territories of American Samoa, the Northern Mariana Islands and Guam is collected by the Census Bureau every decade in its Island Area Census. In 2020, about 10% of Native Hawaiians and Pacific Islanders in the U.S. and its territories lived in the three U.S. Pacific Islands. The other 90% lived in the 50 states or D.C.
For more information, read “What is the relationship between the United States, Pacific Island nations and territories, and their people?”
Here are some key facts about NHPIs living in the 50 states and the District of Columbia, based mainly on U.S. Census Bureau data.
- How has the NHPI population in the U.S. changed over time?
- Where do NHPIs in the U.S. trace their origins?
- How many NHPIs are multiracial?
- Where in the U.S. do NHPIs live?
- Where were NHPIs born?
- How old are NHPIs?
- How many NHPIs are in intermarriages?
- How many NHPIs have a college degree?
- How much do NHPIs make annually?
- How do NHPIs identify politically?
What is the relationship between the U.S., Pacific Island nations and territories, and their people?
The United States has long-standing political, economic and military ties with many Pacific Island nations and territories. Around the turn of the 20th century, the U.S. took control of several Pacific Islands in different ways. For example, Guam was a Spanish colony ceded to the U.S. after the Spanish-American War. Hawai‘i was an independent kingdom that Americans illegally overthrew in 1893 – an act Congress apologized for a century later.
Hawaii became a U.S. territory in 1900 and a state in 1959. Three other Pacific Islands are U.S. territories with permanent populations:
- Guam (since 1899)
- American Samoa (since 1900)
- Commonwealth of the Northern Mariana Islands (since 1986)
Not all people from these three territories are U.S. citizens. For instance, people born in American Samoa are U.S. nationals, meaning they can live and work in the U.S. without a visa. But they lack other rights, including the right to vote in federal elections.
Residents of these territories have limited political representation in other ways. Each territory elects a delegate to the U.S. House of Representatives, but those delegates cannot vote on final passage of legislation. (People living in the District of Columbia, Puerto Rico and the U.S. Virgin Islands have the same form of representation.)
About 150,000 Native Hawaiians or Pacific Islanders live in these three territories today. Native Hawaiians or Pacific Islanders made up about 60% of the territories’ populations in 2020, the most recent year data was available.
Some U.S. Pacific Islanders also have ties to three countries known as the Freely Associated States:
- The Republic of the Marshall Islands
- The Federated States of Micronesia
- The Republic of Palau
These independent nations have agreements with the U.S. to host military bases and support U.S. defense strategy in exchange for economic assistance. Citizens of these countries have the right to live and work in the U.S. as “nonimmigrants.”
Some Pacific Islanders in the U.S. also trace their origins to other islands in Oceania that do not have a special political status with the U.S.
How has the Native Hawaiian or Pacific Islander population in the U.S. changed over time?
| Year | Single race | Multiracial |
|---|---|---|
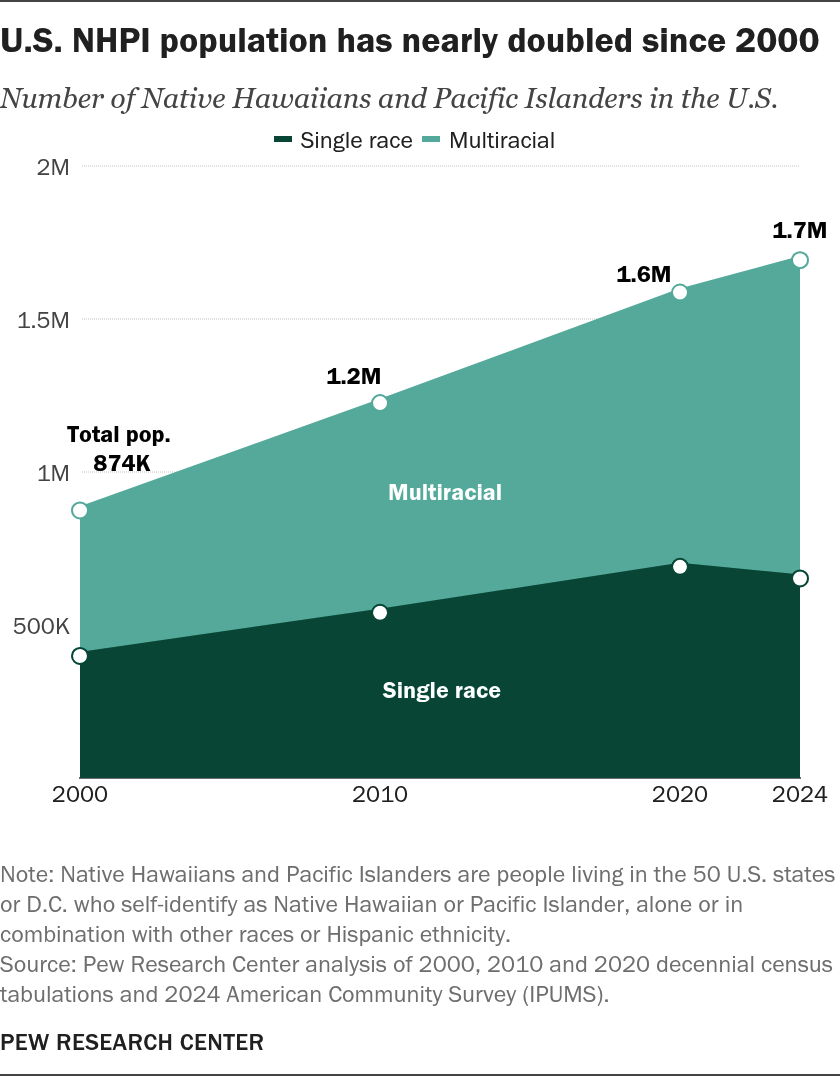
| 2000 | 398,835 | 475,579 |
| 2010 | 540,013 | 685,182 |
| 2020 | 689,966 | 896,497 |
| 2024 | 652,181 | 1,040,189 |
Between 2000 and 2024, the number of NHPIs living in the 50 states and D.C. grew by 94%, from 875,000 to 1.7 million. In the same time frame, the U.S. population overall grew by 21%.
That rapid growth in the NHPI population was largely because there were more people identifying as NHPI and at least one other race. Since 2000, the multiracial NHPI population grew by 119%, while the single-race NHPI population grew by 64%. This was part of a broader increase in multiracial Americans over the same period.
In Hawaii alone, the NHPI population expanded by 42%, from 283,000 in 2000 to 402,000 in 2024. The share of Hawaii’s population that is NHPI rose slightly, from 23% to 28%.
In 1900 – the first census after Hawaii became a U.S. territory – 38,000 of Native Hawaiians were counted, making up 24% of the population.
Where do Native Hawaiians and Pacific Islanders in the U.S. trace their origins?

| NHPI detailed group | NHPI region | Population |
|---|---|---|
| Native Hawaiian | Polynesian | 728,718 |
| Samoan | Polynesian | 271,387 |
| Tongan | Polynesian | 84,616 |
| Other Polynesian | Polynesian | 45,853 |
| Chamorro | Micronesian | 167,504 |
| Marshallese | Micronesian | 42,327 |
| Guamanian | Micronesian | 23,326 |
| Chuukese | Micronesian | 8,446 |
| Other Micronesian | Micronesian | 79,469 |
| Fijian | Melanesian | 58,619 |
| Other Melanesian | Melanesian | 4,681 |
Native Hawaiians and Pacific Islanders include people who trace their origins to Hawaii, Guam, Samoa or other Pacific Islands in Oceania.
The Census Bureau categorizes NHPI origins to three regions of Oceania. People of Polynesian origin make up the largest share of NHPIs in the U.S. They are followed by people of Micronesian origin, then those of Melanesian origin.
Across these regions, Native Hawaiians are the largest single origin group. In 2024, the 729,000 Native Hawaiians living in the U.S. were 43% of the total NHPI population.
The next-largest groups are Samoans (271,000) and Chamorros (168,000). Chamorros trace their origins to the Mariana Islands, an area that includes Guam and the Northern Mariana Islands.
Additionally, about 270,000 people in the U.S. identified as NHPI but did not specify their origin.
For more detailed information on Native Hawaiian or Pacific Islander groups, refer to the Census Bureau’s 2020 population data.
How many Native Hawaiians and Pacific Islanders are multiracial?
| Race group | Percentage |
|---|---|
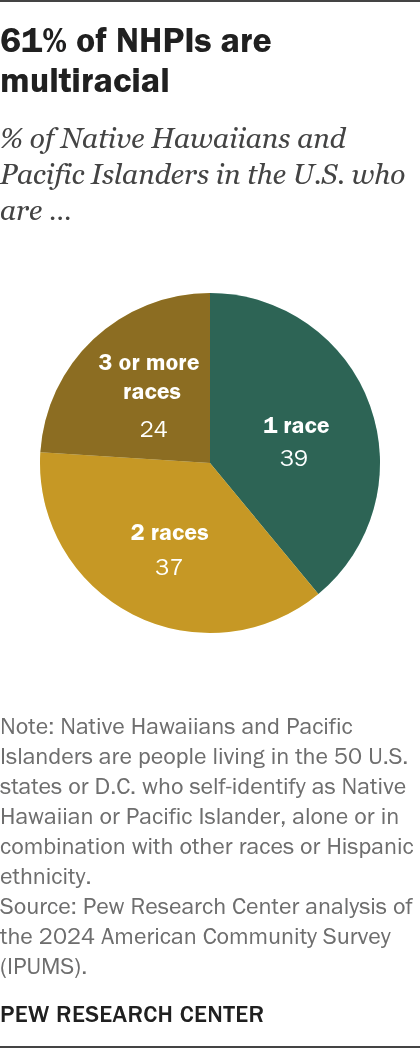
| 1 race | 39 |
| 2 races | 37 |
| 3 or more races | 24 |
About six-in-ten Native Hawaiians and Pacific Islanders (61%) identify with two or more races, as of 2024. This share is much higher than for the U.S. population overall (13%).
Nearly four-in-ten NHPIs (37%) identify with two races:
- 17% are NHPI and White
- 13% are NHPI and Asian
- 7% are NHPI and another race
Another quarter (24%) identify with three or more races – for example, NHPI, White and Asian.
Native Hawaiians are much more likely than Pacific Islanders to be multiracial: 74% of Native Hawaiians identify with two or more races, compared with 53% of Pacific Islanders.
Additionally, 18% of NHPIs are Hispanic. This is similar to the share of the U.S. population overall (20%). (The Census Bureau considers “Hispanic” to be an ethnicity, not a race.)
Where in the U.S. do Native Hawaiians and Pacific Islanders live?
| State | FIPS | NHPI population |
|---|---|---|
| Alabama | 1 | 13,977 |
| Alaska | 2 | 21,955 |
| Arizona | 4 | 43,400 |
| Arkansas | 5 | 18,429 |
| California | 6 | 341,579 |
| Colorado | 8 | 30,431 |
| Connecticut | 9 | 11,271 |
| Delaware | 10 | 2,109 |
| District of Columbia | 11 | 1,485 |
| Florida | 12 | 47,395 |
| Georgia | 13 | 25,931 |
| Hawaii | 15 | 398,148 |
| Idaho | 16 | 6,963 |
| Illinois | 17 | 24,600 |
| Indiana | 18 | 9,139 |
| Iowa | 19 | 11,671 |
| Kansas | 20 | 12,364 |
| Kentucky | 21 | 8,441 |
| Louisiana | 22 | 7,476 |
| Maine | 23 | 1,044 |
| Maryland | 24 | 18,521 |
| Massachussets | 25 | 12,530 |
| Michigan | 26 | 13,207 |
| Minnesota | 27 | 12,869 |
| Mississippi | 28 | 4,105 |
| Missouri | 29 | 20,952 |
| Montana | 30 | 3,364 |
| Nebraska | 31 | 5,585 |
| Nevada | 32 | 59,921 |
| New Hampshire | 33 | 1,864 |
| New Jersey | 34 | 14,977 |
| New Mexico | 35 | 7,828 |
| New York | 36 | 29,199 |
| North Carolina | 37 | 24,661 |
| North Dakota | 38 | 2,892 |
| Ohio | 39 | 20,266 |
| Oklahoma | 40 | 18,904 |
| Oregon | 41 | 37,640 |
| Pennsylvania | 42 | 15,631 |
| Rhode Island | 44 | 1,062 |
| South Carolina | 45 | 11,744 |
| South Dakota | 46 | 462 |
| Tennessee | 47 | 10,560 |
| Texas | 48 | 82,753 |
| Utah | 49 | 56,465 |
| Vermont | 50 | 441 |
| Virginia | 51 | 23,950 |
| Washington | 53 | 106,650 |
| West Virginia | 54 | 2,416 |
| Wisconsin | 55 | 16,537 |
| Wyoming | 56 | 3,019 |
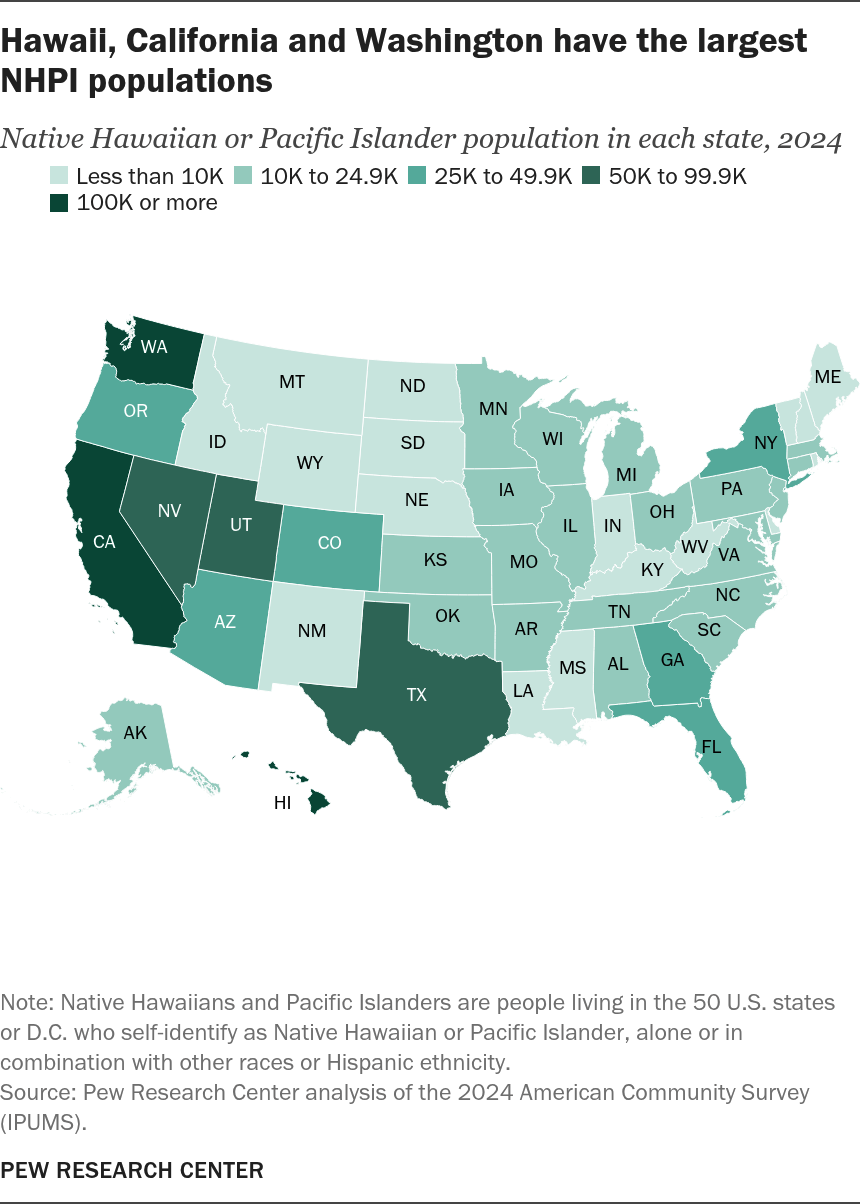
About 1.3 million Native Hawaiians and Pacific Islanders live in the continental U.S. – that is, in the lower 48 states, D.C. or Alaska. Another 398,000, or roughly a quarter of all U.S. NHPIs, live in Hawaii.
After Hawaii, the states with the most NHPIs are:
- California: 342,000
- Washington: 107,000
- Texas: 83,000
Honolulu is the top metropolitan area for NHPIs by far. About 256,000 NHPIs live there, making up 26% of all Honolulu residents.
After Honolulu, the metro areas with the most NHPIs are Los Angeles (85,000) and Seattle (69,000).
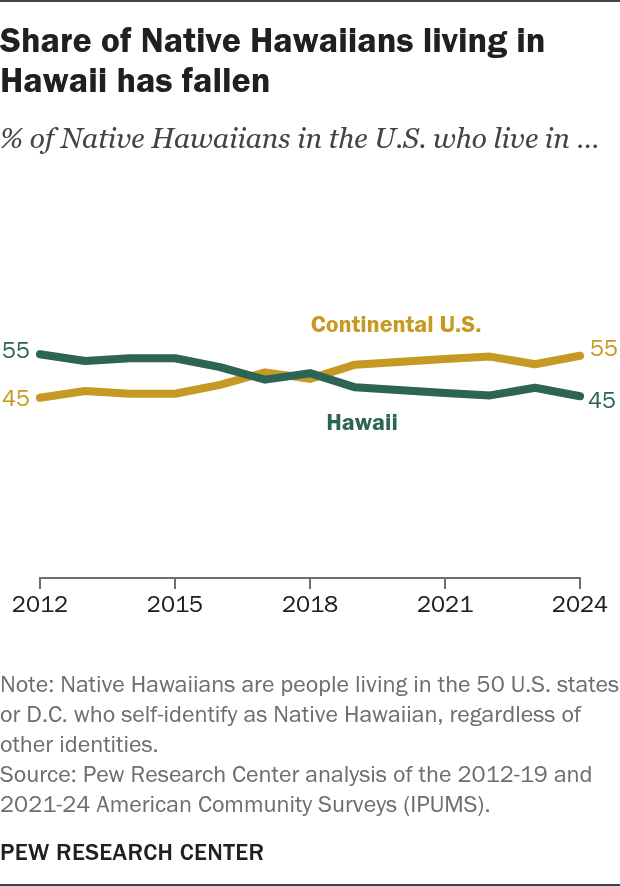
Note: Native Hawaiians are people living in the 50 U.S. states or D.C. who self-identify as Native Hawaiian, regardless of other identities.
| Year | Hawaii | Continental U.S. |
|---|---|---|
| 2012 | 55.4 | 44.6 |
| 2013 | 53.7 | 46.3 |
| 2014 | 54.4 | 45.6 |
| 2015 | 54.4 | 45.6 |
| 2016 | 52.2 | 47.8 |
| 2017 | 49.1 | 50.9 |
| 2018 | 50.7 | 49.3 |
| 2019 | 47.2 | 52.8 |
| 2021 | 45.8 | 54.2 |
| 2022 | 45.2 | 54.8 |
| 2023 | 47.1 | 52.9 |
| 2024 | 45.0 | 55.0 |
Note: Native Hawaiians are people living in the 50 U.S. states or D.C. who self-identify as Native Hawaiian, regardless of other identities.
The Native Hawaiian population in Hawaii
In 2024, 45% of all Native Hawaiians in the U.S. lived in Hawaii, and 55% lived in the continental U.S. This has flipped since 2012, when 55% lived in Hawaii.
At the same time, the share of people living in Hawaii who are Native Hawaiian has stayed relatively stable since 2012, at about one-in-five.
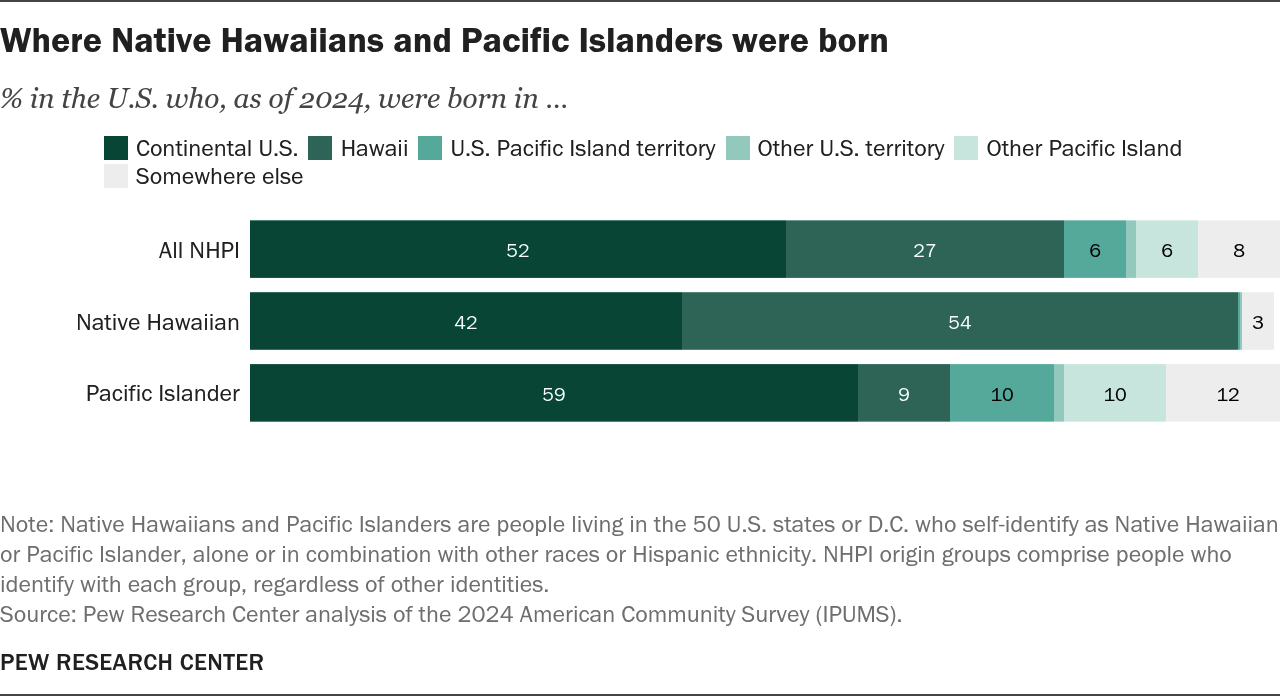
Where were Native Hawaiians and Pacific Islanders born?
Most Native Hawaiians and Pacific Islanders living in the 50 states and D.C. were born in a U.S. state or territory:
- 52% were born in the continental U.S.
- 27% were born in Hawaii
- 6% were born in a U.S. Pacific Island territory
Another 14% were born elsewhere, including a Pacific Island nation (6%) or another country (8%).
Nearly all Native Hawaiians were born in Hawaii or the continental U.S. Meanwhile, a majority of Pacific Islanders were born in the continental U.S., and about one-in-ten each were born in Hawaii, a U.S. Pacific Island territory, a Pacific Island nation or somewhere else.
| Continental U.S. | Hawaii | U.S. Pacific Island territory | Other U.S. territory | Other Pacific Island | Somewhere else | |
|---|---|---|---|---|---|---|
| All NHPI | 52 | 27 | 6 | 1 | 6 | 8 |
| Native Hawaiian | 42 | 54 | 0.2 | 0.04 | 0.1 | 3 |
| Pacific Islander | 59 | 9 | 10 | 1 | 10 | 12 |
How old are Native Hawaiians and Pacific Islanders?
Native Hawaiians and Pacific Islanders are much younger than the U.S. population overall. In 2024, the median age of NHPIs was 30.3 years. That means half of NHPIs were younger than that and half were older. The median age of all Americans was 39.2 years – nearly a decade older.
In addition, 31% of all Native Hawaiians and Pacific Islanders were under 18, compared with 21% of all Americans. Multiracial NHPIs tended to be younger than single-race NHPIs (median age of 28.0 vs. 33.0).
How many Native Hawaiians and Pacific Islanders are in intermarriages?
About 458,000 NHPI adults were married and living with their spouse in 2024. The majority (59%) were in intermarriages – meaning they were married to someone who is not NHPI.
Intermarriages are much more common for NHPIs than for most other racial and ethnic groups. Only married American Indian or Alaska Native adults have a similar intermarriage rate (59%). Other groups have much lower rates:
- 23% of married Hispanic adults
- 21% of married Asian adults
- 18% of married Black adults
- 4% of married White adults
| Year | Native Hawaiian or Pacific Islander adults | All U.S. adults |
|---|---|---|
| 2000 | 16.9 | 24.4 |
| 2006 | 16.5 | 27.0 |
| 2007 | 16.9 | 27.5 |
| 2008 | 17.2 | 27.7 |
| 2009 | 17.2 | 27.9 |
| 2010 | 19.9 | 28.2 |
| 2011 | 19.4 | 28.6 |
| 2012 | 21.4 | 29.2 |
| 2013 | 21.5 | 29.6 |
| 2014 | 21.1 | 30.1 |
| 2015 | 22.2 | 30.7 |
| 2016 | 23.3 | 31.3 |
| 2017 | 24.0 | 32.0 |
| 2018 | 24.8 | 32.6 |
| 2019 | 24.0 | 33.2 |
| 2021 | 25.4 | 35.0 |
| 2022 | 26.4 | 35.7 |
| 2023 | 25.9 | 36.2 |
| 2024 | 27.1 | 36.9 |
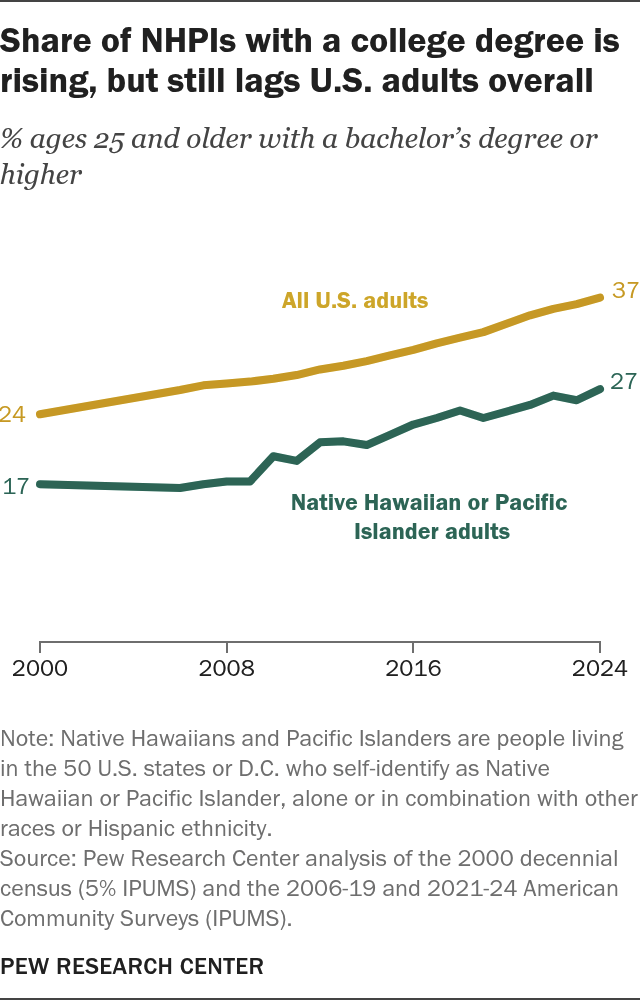
How many Native Hawaiians and Pacific Islanders have a college degree?
In 2024, 27% of Native Hawaiians and Pacific Islanders ages 25 and older had a bachelor’s degree or more education. That was up from 17% in 2000.
Native Hawaiian or Pacific Islander adults are less likely than U.S. adults overall to have a college degree (27% vs. 37%). The gap between these groups has widened slightly since 2000.
Multiracial NHPIs are more likely than single-race NHPIs to have a bachelor’s degree (32% vs. 20%). But the shares in both groups have increased since 2000.
How much do Native Hawaiians and Pacific Islanders make annually?
The annual median income of a Native Hawaiian or Pacific Islander household was $93,600 in 2024. This is similar to the median income for all U.S. households ($95,300).
But in Hawaii, NHPI households had a median income of $100,000, which was lower than the $112,200 for all Hawaii households.
(In this analysis, household income follows the Census Bureau’s definition and is adjusted to reflect a household size of three. Learn more about what is included as income and the adjustments we made.)
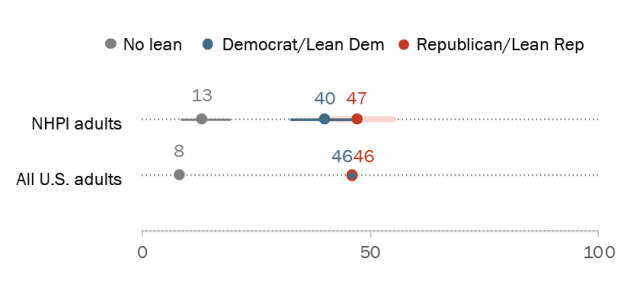
How do Native Hawaiians and Pacific Islanders identify politically?
| Group | No lean | No lean lower | No lean upper | Rep/Lean Rep | Rep/Lean Rep lower | Rep/Lean Rep upper | Dem/Lean Dem | Dem/Lean Dem lower | Dem/Lean Dem upper |
|---|---|---|---|---|---|---|---|---|---|
| NHPI adults | 12.7 | 8.3 | 19.0 | 47.2 | 39.3 | 55.2 | 40.1 | 32.7 | 48.0 |
| All U.S. adults | 7.6 | 7.5 | 7.7 | 46.2 | 46.0 | 46.5 | 46.2 | 46.0 | 46.5 |
In a Center survey from 2023 and 2024, NHPI adults were about evenly divided in their party affiliations.
- 47% identified as Republicans or leaned toward the Republican Party.
- 40% were Democrats or Democratic leaners.
Additionally, about one-in-ten did not identify with or lean toward either party.
The shares of NHPIs who identify as Republican or Democratic are not significantly different from each other. NHPI adults also don’t differ from U.S. adults overall in how they identify politically. There were relatively few NHPI adults in this survey – so these estimates come with wide error bars.
Native Hawaiians and Pacific Islanders are a small but growing segment of the U.S. electorate. In 2024, around 1.1 million NHPIs were eligible to vote in the 50 states and D.C. That was up from 473,000 in 2000. (Eligible voters are U.S. citizens ages 18 and older.)


