
A declining share of U.S. adults are following the news closely, according to recent Pew Research Center surveys. And audiences are shrinking for several older types of news media – such as local TV stations, most newspapers and public radio – even as they grow for newer platforms like podcasts, as well as for a few specific media brands.
Pew Research Center has long tracked trends in the news industry. In addition to asking survey questions about Americans’ news consumption habits, our State of the News Media project uses several other data sources to look at various aspects of the industry, including audience size, revenue and other metrics.
The data in this analysis comes from a variety of sources as part of Pew Research Center’s State of the News Media fact sheets. The fact sheets use a range of methodologies to study the health of the U.S. news industry, including analysis of industry data and direct reporting to solicit information unavailable elsewhere. All sources are cited in chart and graphic notes or within the text of the fact sheets. Read the methodology.
Pew Research Center is a subsidiary of The Pew Charitable Trusts, its primary funder. This is the latest report in Pew Research Center’s ongoing investigation of the state of news, information and journalism in the digital age, a research program funded by The Pew Charitable Trusts, with generous support from the John S. and James L. Knight Foundation.
The latest data shows a complex picture. Here are some of our key findings:
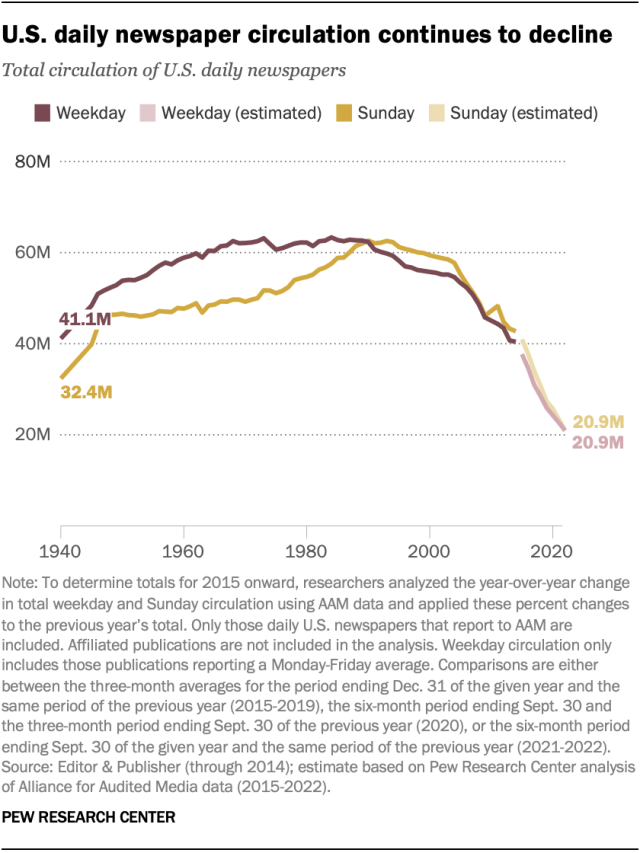
- For the most part, daily newspaper circulation nationwide – counting digital subscriptions and print circulation – continues to decline, falling to just under 21 million in 2022, according to projections using data from the Alliance for Audited Media (AAM). Weekday circulation is down 8% from the previous year and 32% from five years prior, when it was over 30 million. Out of 136 papers included in this analysis, 120 experienced declines in weekday circulation in 2022.
- While most newspapers in the United States are struggling, some of the biggest brands are experiencing digital growth. AAM data does not include all digital circulation to three of the nation’s most prominent newspapers: The New York Times, The Wall Street Journal and The Washington Post. But while all three are experiencing declines in their print subscriptions, other available data suggests substantial increases in digital subscriptions for The New York Times and The Wall Street Journal. (Similar data is not available for The Washington Post.) For example, The New York Times saw a 32% increase in digital-only subscriptions in 2022, surpassing 10 million subscribers and continuing years of growth, according to filings with the U.S. Securities and Exchange Commission (SEC). There are many reasons this data is not directly comparable with the AAM data, including the fact that some digital subscriptions to The New York Times do not include news and are limited to other products like cooking and games. Still, these brands are bucking the overall trend.
- Overall, digital traffic to newspapers’ websites is declining. The average monthly number of unique visitors to the websites of the country’s top 50 newspapers (based on circulation, and including The New York Times, The Wall Street Journal and The Washington Post) declined 20% to under 9 million in the fourth quarter of 2022, down from over 11 million in the same period in 2021, according to Comscore data. The length of the average visit to these sites is also falling – to just under a minute and a half in the last quarter of 2022.
- Traffic to top digital news websites is not picking up the slack. Overall, traffic to the most visited news websites – those with at least 10 million unique visitors per month in the fourth quarter of a given year – has declined over the past two years. The average number of monthly unique visitors to these sites was 3% lower in October-December 2022 than in the same period in 2021, following a 13% drop the year before that, according to Comscore. The length of the average visit to these sites is getting shorter, too. (These sites can include newspapers’ websites, such as that of The New York Times, as well as other digital news sites like those of CNN, Fox News or Axios.)
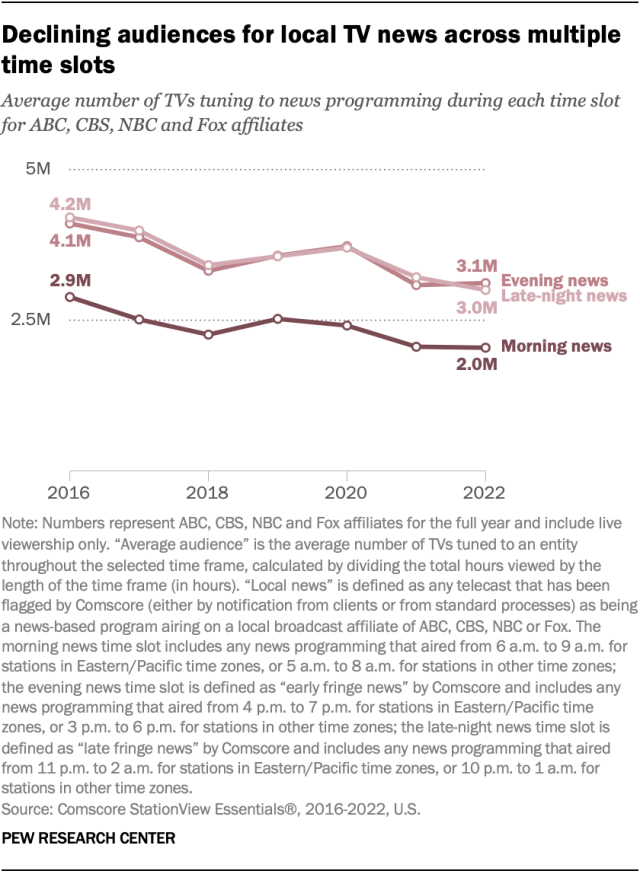
- Across several years of data, there has been a drop in audiences for local TV news, affecting morning, evening and late-night time slots alike. For example, the average number of TVs tuning into ABC, CBS, NBC and Fox affiliates for the evening news was just over 3 million in 2022, down from just over 4 million in 2016.
- Audience trends are a little more mixed when it comes to TV news on cable and network stations. Prime-time and daytime audiences for CNN, Fox News and MSNBC all grew in 2020, the first year of the COVID-19 pandemic, before declining in 2021. Fox News’ audiences ticked back up in 2022, while the audiences for the other two channels continued to decline.
- Audiences for news programming on ABC, CBS and NBC have been relatively stable in recent years, with some variation depending on the time slot. Audiences for evening news are up slightly since 2016 on all three networks, but they are modestly down for morning news.
- The story is mixed when it comes to audio, too. The share of Americans who listen to terrestrial radio has declined in recent years, as has listenership on NPR and PRX. But there has been a clear rise in audiences for podcasts and other types of online audio. Although podcasts often are not news-related, about two-thirds of U.S. podcast listeners say they hear news discussed on the podcasts they listen to.
Economic trends in the news industry
Declines in audience don’t necessarily mean declines in revenue, with some industries faring better than others in 2022. The newspaper industry and network television, for example, saw losses in advertising revenue, while local TV revenue followed typical patterns associated with election years.
Here are some data points on how these media sectors are faring economically, based on data from filings with the SEC, industry tracking companies and other sources:
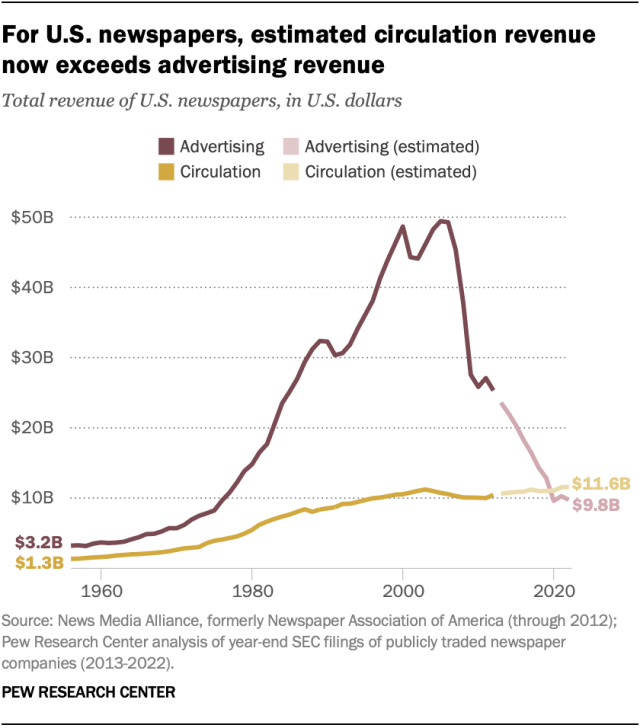
- Advertising revenue for newspapers has continued to decline steadily. In 2020, projections of circulation revenue surpassed advertising revenue for the first time since at least 1956 (the first year for which data is available), and that pattern has held steady in recent years. The makeup of advertising revenue is changing as well: Nearly half of newspaper companies’ advertising revenue (48%) came from digital advertising in 2022, up from 19% in 2012.
- For local television, advertising revenue has remained roughly stable on the whole, bolstered by increased digital advertising and consistent spikes in political advertising revenue during election years. Political advertising, in particular, has grown over the past decade, increasing from roughly $600 million in the 2012 presidential election year to about $1.9 billion in 2022 (a midterm election year). Local TV stations also have seen increasing revenue from retransmission fees, paid by cable and satellite systems to carry local channels.
- Local public radio station revenue has increased, from roughly $1.1 billion in 2020 to about $1.2 billion in 2021. Revenue for NPR, specifically, increased 8% between 2021 and 2022.
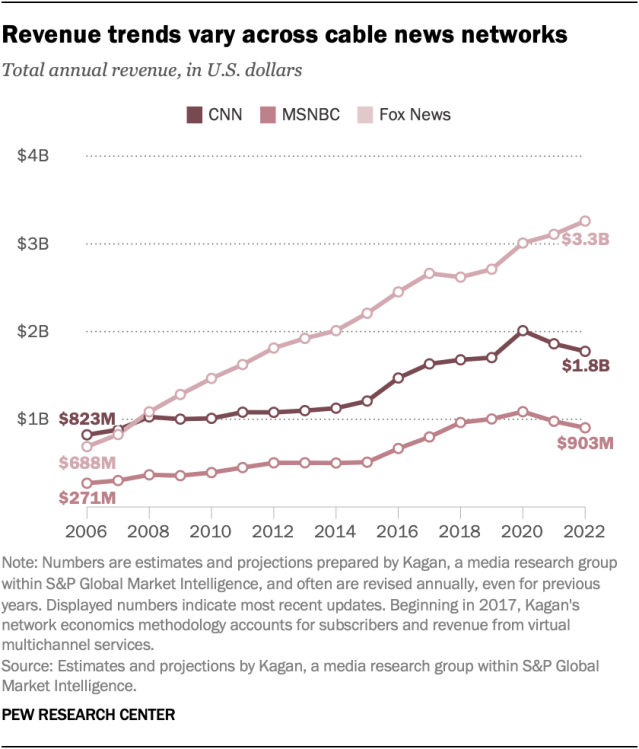
- Revenue trends for cable TV news vary depending on the network. Among the three major cable news networks, Fox News led in both total revenue and net advertising revenue, which increased from 2020 to 2022. CNN and MSNBC saw slight declines over the same period.
- Advertising revenue has generally declined for ABC, CBS and NBC news programming since 2020, in both the morning and evening time slots.

