
In a fragmented media environment with seemingly endless sources of information to choose from, Americans’ news habits have changed dramatically in the 21st century. Today, an overwhelming majority of American adults get news at least sometimes from digital devices. This fact sheet looks at the platforms Americans turn to for news, including patterns and trends.

News consumption across all platforms
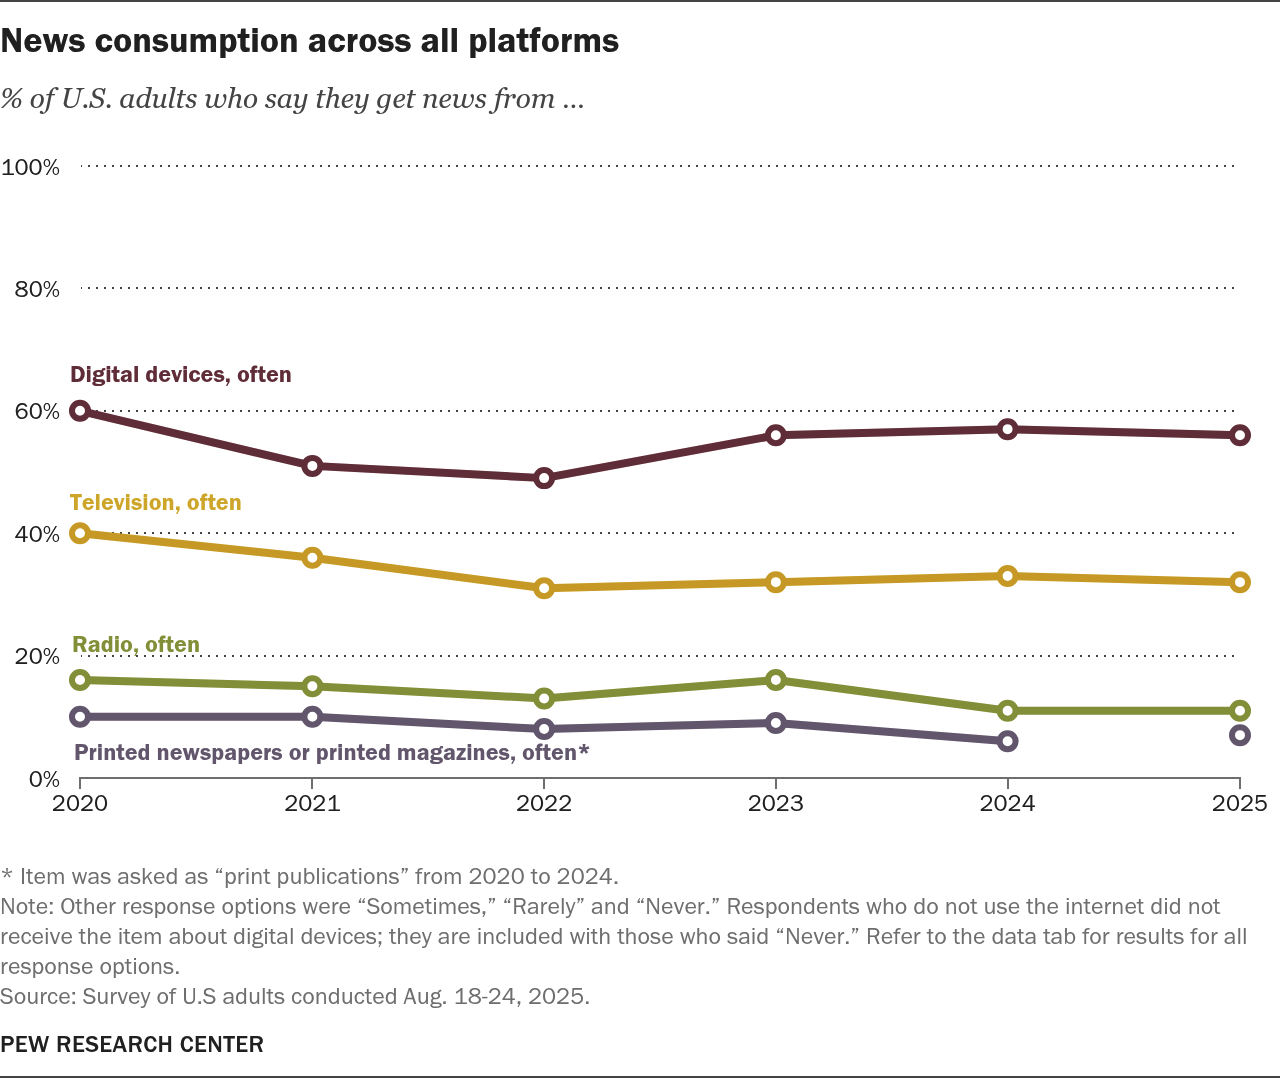
A large majority of U.S. adults (86%) say they at least sometimes get news from a smartphone, computer or tablet, including 56% who say they do so often. This figure is almost identical to the share who said they at least sometimes got news from digital devices in 2024.
Digital devices are by far the most common way Americans get news, although a majority (64%) get news from television at least sometimes. This includes 32% who say they often get news from TV, which has stayed fairly steady over the last few years.
Americans turn to radio and print publications for news less frequently. In 2025, 11% of U.S. adults say they often get news from radio, and 7% say the same about printed newspapers or magazines – both roughly the same as last year.
Note: Other response options were “Sometimes,” “Rarely” and “Never.” Respondents who do not use the internet did not receive the item about digital devices; they are included with those who said “Never.” Refer to the data tab for results for all response options.
| Year | Digital devices, often | Digital devices, sometimes | Digital devices, rarely | Digital devices, never | Television, often | Television, sometimes | Television, rarely | Television, never | Radio, often | Radio, sometimes | Radio, rarely | Radio, never | Print publications, often | Print publications, sometimes | Print publications, rarely | Print publications, never | Printed newspapers or printed magazines, often | Printed newspapers or printed magazines, sometimes | Printed newspapers or printed magazines, rarely | Printed newspapers or printed magazines, never |
|---|---|---|---|---|---|---|---|---|---|---|---|---|---|---|---|---|---|---|---|---|
| 2020 | 60% | 26% | 7% | 7% | 40% | 28% | 20% | 11% | 16% | 34% | 28% | 21% | 10% | 22% | 39% | 29% | — | — | — | — |
| 2021 | 51 | 33 | 8 | 8 | 36 | 32 | 20 | 12 | 15 | 36 | 27 | 22 | 10 | 24 | 33 | 32 | — | — | — | — |
| 2022 | 49 | 33 | 10 | 8 | 31 | 33 | 21 | 14 | 13 | 34 | 29 | 24 | 8 | 25 | 34 | 33 | — | — | — | — |
| 2023 | 56 | 29 | 8 | 6 | 32 | 30 | 22 | 15 | 16 | 35 | 25 | 23 | 9 | 28 | 33 | 30 | — | — | — | — |
| 2024 | 57 | 29 | 8 | 6 | 33 | 31 | 22 | 14 | 11 | 31 | 29 | 29 | 6 | 19 | 37 | 37 | — | — | — | — |
| 2025 | 56 | 30 | 7 | 7 | 32 | 31 | 22 | 14 | 11 | 33 | 28 | 27 | — | — | — | — | 7 | 18 | 34 | 40 |
Note: Other response options were “Sometimes,” “Rarely” and “Never.” Respondents who do not use the internet did not receive the item about digital devices; they are included with those who said “Never.” Refer to the data tab for results for all response options.

News consumption across digital platforms
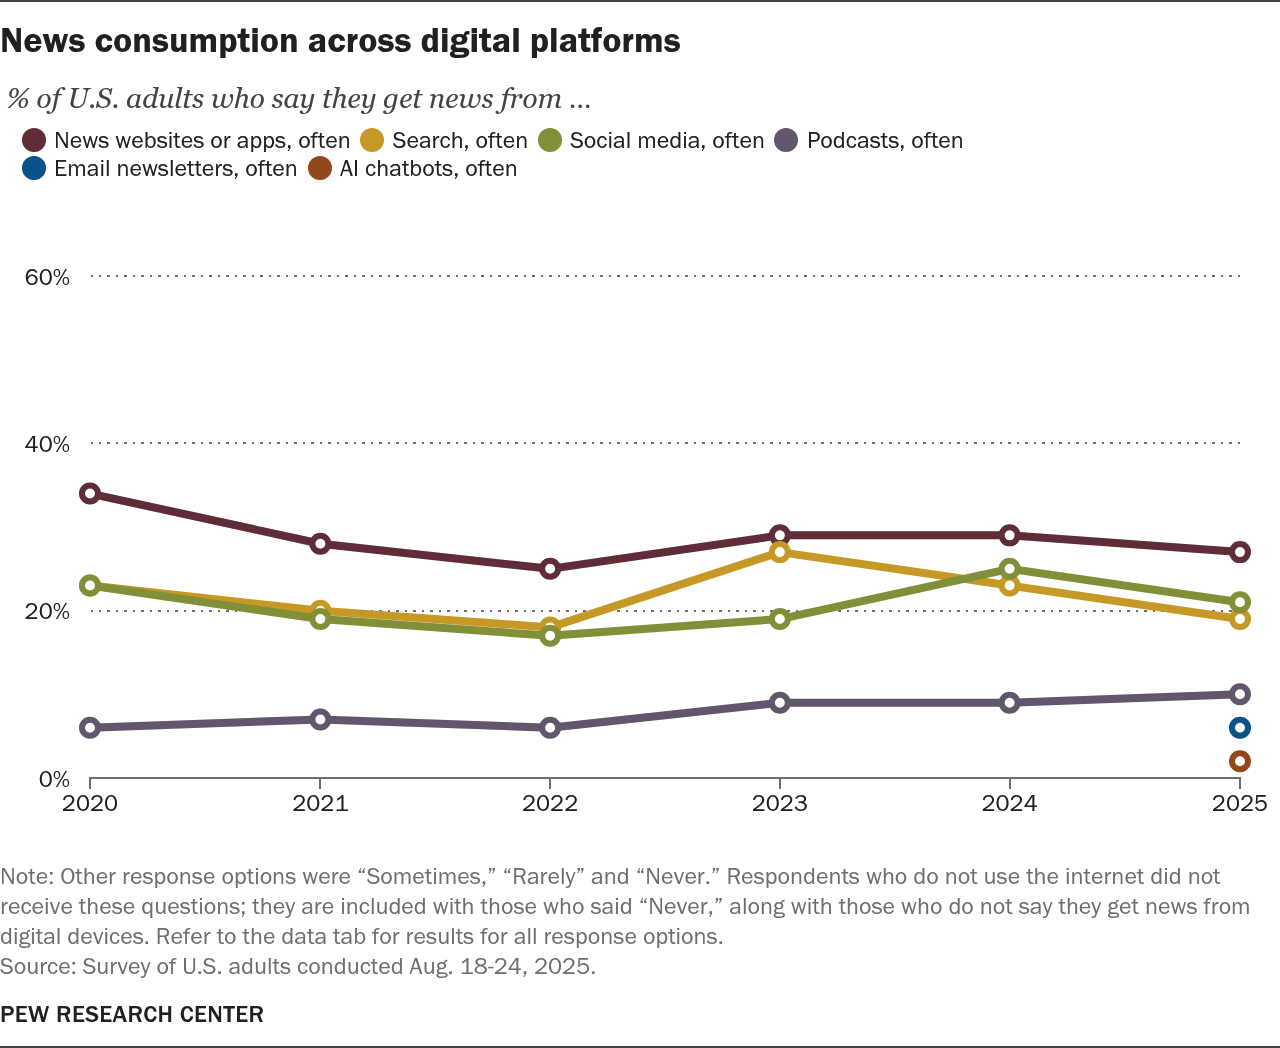
There are several different pathways Americans use to get news on their digital devices. News websites or apps, social media, and search engines are the most common: About one-in-five or more U.S. adults often get news in each of these ways. One-in-ten often get news from podcasts, while smaller shares say the same about email newsletters (6%) and artificial intelligence (AI) chatbots such as ChatGPT or Google Gemini (2%).
| Year | News websites or apps, often | News websites or apps, sometimes | News websites or apps, rarely | News websites or apps, never | Search, often | Search, sometimes | Search, rarely | Search, never | Social media, often | Social media, sometimes | Social media, rarely | Social media, never | Podcasts, often | Podcasts, sometimes | Podcasts, rarely | Podcasts, never | Email newsletters, often | Email newsletters, sometimes | Email newsletters, rarely | Email newsletters, never | AI chatbots, often | AI chatbots, sometimes | AI chatbots, rarely | AI chatbots, never |
|---|---|---|---|---|---|---|---|---|---|---|---|---|---|---|---|---|---|---|---|---|---|---|---|---|
| 2020 | 34% | 35% | 16% | 15% | 23% | 41% | 20% | 15% | 23% | 30% | 18% | 29% | 6% | 16% | 24% | 53% | — | — | — | — | — | — | — | — |
| 2021 | 28 | 38 | 17 | 18 | 20 | 43 | 19 | 18 | 19 | 29 | 19 | 32 | 7 | 16 | 21 | 56 | — | — | — | — | — | — | — | — |
| 2022 | 25 | 38 | 19 | 18 | 18 | 42 | 22 | 18 | 17 | 33 | 20 | 29 | 6 | 17 | 22 | 55 | — | — | — | — | — | — | — | — |
| 2023 | 29 | 38 | 16 | 16 | 27 | 44 | 15 | 13 | 19 | 31 | 19 | 31 | 9 | 21 | 22 | 47 | — | — | — | — | — | — | — | — |
| 2024 | 29 | 36 | 17 | 17 | 23 | 43 | 19 | 15 | 25 | 29 | 18 | 28 | 9 | 18 | 22 | 50 | — | — | — | — | — | — | — | — |
| 2025 | 27 | 37 | 18 | 17 | 19 | 44 | 21 | 15 | 21 | 32 | 19 | 27 | 10 | 22 | 22 | 46 | 6 | 24 | 26 | 43 | 2 | 7 | 16 | 75 |
Preferences for each news platform
When asked which of these platforms they prefer to get news on, about a third of Americans (34%) say they prefer television. Relatively few prefer radio or print (5% each).
Americans have a range of preferences when it comes to news on digital platforms. About a fifth of U.S. adults (21%) say they prefer to get their news from news websites or apps, while 14% prefer social media, 10% prefer search, 6% prefer podcasts and 3% prefer email newsletters. Fewer than 1% say they prefer AI chatbots for getting news.
Read more about how Americans get news on social media.
News platform preferences
% of U.S. adults who prefer __ for getting news
* Item was asked as “print publications” from 2020 to 2024.
Note: Refer to our detailed tables for the underlying data.
Source: Survey of U.S. adults conducted Aug. 18-24, 2025.
PEW RESEARCH CENTER

Who uses each news platform?
News consumption across platforms varies by age, gender, race, ethnicity and educational attainment. For example, Americans ages 50 and older are more likely than younger adults to turn to television and print publications for news – and less likely to use digital sources such as social media or podcasts.
Americans with a college degree are more likely than those without one to get news at least sometimes from news websites or apps, podcasts, or email newsletters. Those without a college degree, on the other hand, are more likely than those with one to say they get news from social media.
Tab Contents
% of U.S. adults in each demographic group who say they get news often or sometimes from …
| Television | Radio | Printed newspapers or printed magazines** | Digital devices | |
|---|---|---|---|---|
| U.S. adults | 64% | 44% | 25% | 86% |
| Men | 61 | 43 | 24 | 88 |
| Women | 67 | 46 | 25 | 84 |
| Ages 18-29 | 47 | 33 | 18 | 93 |
| 30-49 | 51 | 46 | 22 | 92 |
| 50-64 | 74 | 52 | 23 | 85 |
| 65+ | 87 | 44 | 37 | 71 |
| HS or less | 69 | 45 | 25 | 79 |
| Some college | 65 | 43 | 21 | 88 |
| College+ | 58 | 44 | 28 | 92 |
| White | 63 | 45 | 26 | 87 |
| Black | 75 | 46 | 26 | 82 |
| Hispanic | 65 | 41 | 20 | 83 |
| Asian* | 54 | 38 | 25 | 91 |
| Rep/Lean Rep | 65 | 47 | 23 | 86 |
| Dem/Lean Dem | 63 | 43 | 27 | 87 |
* Estimates for Asian adults are representative of English speakers only.
** Item was asked as “print publications” from 2020 to 2024.
Note: Other response options were “Rarely” and “Never.” Respondents who do not use the internet did not receive the item about digital devices; they are included with those who said “Never.” White, Black and Asian adults include those who report being only one race and are not Hispanic; Hispanic adults are of any race.
Source: Survey of U.S. adults conducted Aug. 18-24, 2025.
PEW RESEARCH CENTER
% of U.S. adults in each demographic group who say they get news often or sometimes from …
| News websites or apps | Social media | Search | Podcasts | Email newsletters | AI chatbots | |
|---|---|---|---|---|---|---|
| U.S. adults | 65% | 53% | 63% | 32% | 30% | 9% |
| Men | 66 | 50 | 63 | 35 | 29 | 8 |
| Women | 64 | 56 | 64 | 28 | 31 | 9 |
| Ages 18-29 | 60 | 76 | 69 | 39 | 28 | 13 |
| 30-49 | 68 | 62 | 68 | 39 | 31 | 11 |
| 50-64 | 71 | 46 | 65 | 29 | 32 | 7 |
| 65+ | 57 | 28 | 50 | 18 | 31 | 4 |
| HS or less | 55 | 54 | 57 | 27 | 25 | 10 |
| Some college | 65 | 57 | 67 | 31 | 31 | 8 |
| College+ | 75 | 49 | 67 | 38 | 35 | 9 |
| White | 67 | 50 | 63 | 30 | 29 | 6 |
| Black | 61 | 56 | 68 | 35 | 40 | 13 |
| Hispanic | 58 | 61 | 59 | 33 | 24 | 14 |
| Asian* | 70 | 62 | 70 | 36 | 40 | 19 |
| Rep/Lean Rep | 64 | 55 | 63 | 33 | 29 | 9 |
| Dem/Lean Dem | 68 | 52 | 65 | 32 | 34 | 9 |
* Estimates for Asian adults are representative of English speakers only.
Note: Other response options were “Rarely” and “Never.” Respondents who do not use the internet did not receive these questions; they are included with those who said “Never,” along with those who do not say they get news from digital devices. White, Black and Asian adults include those who report being only one race and are not Hispanic; Hispanic adults are of any race.
Source: Survey of U.S. adults conducted Aug. 18-24, 2025.
PEW RESEARCH CENTER
Tab Contents
% of U.S. adults in each demographic group who prefer __ for getting news
| Television | Radio | Printed newspapers or printed magazines** | |
|---|---|---|---|
| U.S. adults | 34% | 5% | 5% |
| Men | 32 | 5 | 4 |
| Women | 37 | 6 | 6 |
| Ages 18-29 | 12 | 5 | 5 |
| 30-49 | 23 | 6 | 4 |
| 50-64 | 43 | 7 | 4 |
| 65+ | 60 | 4 | 8 |
| HS or less | 46 | 4 | 5 |
| Some college | 34 | 5 | 4 |
| College+ | 21 | 7 | 6 |
| White | 35 | 5 | 6 |
| Black | 42 | 2 | 3 |
| Hispanic | 33 | 6 | 4 |
| Asian* | 24 | 4 | 4 |
| Rep/Lean Rep | 35 | 5 | 4 |
| Dem/Lean Dem | 33 | 5 | 6 |
* Estimates for Asian adults are representative of English speakers only.
** Item was asked as “print publications” from 2020 to 2024.
Note: White, Black and Asian adults include those who report being only one race and are not Hispanic; Hispanic adults are of any race.
Source: Survey of U.S. adults conducted Aug. 18-24, 2025.
PEW RESEARCH CENTER
% of U.S. adults in each demographic group who prefer __ for getting news
| News websites or apps | Social media | Search | Podcasts | Email newsletters | AI chatbots | |
|---|---|---|---|---|---|---|
| U.S. adults | 21% | 14% | 10% | 6% | 3% | <1% |
| Men | 23 | 15 | 10 | 8 | 2 | <1 |
| Women | 19 | 13 | 10 | 5 | 3 | <1 |
| Ages 18-29 | 19 | 31 | 13 | 8 | 4 | 1 |
| 30-49 | 24 | 16 | 12 | 9 | 3 | 1 |
| 50-64 | 23 | 6 | 10 | 5 | 2 | <1 |
| 65+ | 16 | 3 | 4 | 2 | 2 | <1 |
| HS or less | 13 | 15 | 8 | 5 | 2 | 1 |
| Some college | 20 | 16 | 11 | 6 | 2 | <1 |
| College+ | 31 | 11 | 10 | 9 | 4 | <1 |
| White | 23 | 12 | 9 | 7 | 2 | <1 |
| Black | 15 | 15 | 11 | 7 | 1 | 1 |
| Hispanic | 17 | 20 | 10 | 3 | 3 | 1 |
| Asian* | 26 | 18 | 12 | 5 | 6 | <1 |
| Rep/Lean Rep | 19 | 16 | 10 | 8 | 3 | <1 |
| Dem/Lean Dem | 24 | 13 | 9 | 5 | 3 | <1 |
* Estimates for Asian adults are representative of English speakers only.
Note: White, Black and Asian adults include those who report being only one race and are not Hispanic; Hispanic adults are of any race.
Source: Survey of U.S. adults conducted Aug. 18-24, 2025.
PEW RESEARCH CENTER

Find out more
This fact sheet was compiled by Research Analysts Christopher St. Aubin and Jacob Liedke.
Here are the questions used in this analysis, the topline and the methodology.
Follow these links for related research:
- Social Media and News Fact Sheet (Sept. 25, 2025)
- Podcasts and News Fact Sheet (Sept. 25, 2025)
- News Influencers Fact Sheet (Nov. 4, 2025)
- News Media Tracker: How Americans Use and Trust News Sources (June 10, 2025)
- What Is News? (May 13, 2025)
- Americans’ Views of 2024 Election News (Oct. 10, 2024)
- Americans’ Changing Relationship With Local News (May 7, 2024)
- How Hispanic Americans Get Their News (March 19, 2024)
- Black Americans’ Experiences With News (Sept. 26, 2023)
- Podcasts as a Source of News and Information (April 18, 2023)
- The Role of Alternative Social Media in the News and Information Environment (Oct. 6, 2022)
- Americans are following the news less closely than they used to (Oct. 24, 2023)
Check out our other reports and blog posts related to news platforms and sources.