Note: This 2023 fact sheet was part of the last update to our State of the News Media report. Find more updated survey data about local news in our “Local News Fact Sheet” here. Read archived reports on the State of the News Media from 2004-23 and the methodology here.
Television remains a common place for Americans to get their news, and one of the most preferred sources for local news specifically. In 2022, local TV news audiences remained relatively stable from the previous year. Financially, local TV companies generated more revenue in 2022 than in 2021, consistent with a cyclical pattern in which advertising revenue rises in election years and falls in non-election years. Explore patterns and longitudinal data in local TV news below.
Audience
In 2022, viewership for network local affiliate news stations (ABC, CBS, Fox and NBC) stayed relatively stable from 2021 across almost all key time slots, according to Comscore StationView Essentials® data. Local TV average audience (defined as the average number of TVs tuned to a program throughout a time period) for the late night time slot is the only time slot that had any significant change from 2021, with a 7% decline in average audience.
Average audience for local TV news
Tab Contents
Average audience for local TV key time slots
Average number of TVs tuning to news programming during each time slot for ABC, CBS, Fox and NBC affiliates
Note: Numbers represent ABC, CBS, Fox and NBC affiliates for the full year and include live viewership only. “Average audience” is the average number of TVs tuned to an entity throughout the selected time frame, calculated by dividing the total hours viewed by the length of the time frame (in hours). “Local news” is defined as any telecast that has been flagged by Comscore (either by notification from clients or from standard processes) as being a news-based program airing on a local broadcast affiliate of ABC, CBS, NBC or Fox. The morning news time slot includes any news programming that aired from 6 to 9 a.m. for stations in Eastern/Pacific time zones, or 5 to 8 a.m. for stations in other time zones; the evening news time slot is defined as “early fringe news” by Comscore and includes any news programming that aired from 4 to 7 p.m. for stations in Eastern/Pacific time zones, or 3 to 6 p.m. for stations in other time zones; the late night news time slot is defined as “late fringe news” by Comscore and includes any news programming that aired from 11 p.m. to 2 a.m. for stations in Eastern/Pacific time zones, or 10 p.m. to 1 a.m. for stations in other time zones.
Source: Comscore StationView Essentials®, 2016-2022, U.S.
PEW RESEARCH CENTER
Share this chart
Average audience for local TV key time slots
Average number of TVs tuning to news programming during each time slot for ABC, CBS, Fox and NBC affiliates
Note: Numbers represent ABC, CBS, Fox and NBC affiliates for the full year and include live viewership only. “Average audience” is the average number of TVs tuned to an entity throughout the selected time frame, calculated by dividing the total hours viewed by the length of the time frame (in hours). “Local news” is defined as any telecast that has been flagged by Comscore (either by notification from clients or from standard processes) as being a news-based program airing on a local broadcast affiliate of ABC, CBS, NBC or Fox. The morning news time slot includes any news programming that aired from 6 to 9 a.m. for stations in Eastern/Pacific time zones, or 5 to 8 a.m. for stations in other time zones; the evening news time slot is defined as “early fringe news” by Comscore and includes any news programming that aired from 4 to 7 p.m. for stations in Eastern/Pacific time zones, or 3 to 6 p.m. for stations in other time zones; the late night news time slot is defined as “late fringe news” by Comscore and includes any news programming that aired from 11 p.m. to 2 a.m. for stations in Eastern/Pacific time zones, or 10 p.m. to 1 a.m. for stations in other time zones.
Source: Comscore StationView Essentials®, 2016-2022, U.S.
PEW RESEARCH CENTER
Average audience for local TV midday and prime news
Average number of TVs tuning to news programming during each time slot for ABC, CBS, Fox and NBC affiliates
Note: Numbers represent ABC, CBS, Fox and NBC affiliates for the full year and include live viewership only. “Average audience” is the average number of TVs tuned to an entity throughout the selected time frame, calculated by dividing the total hours viewed by the length of the time frame (in hours). “Local news” is defined as any telecast that has been flagged by Comscore (either by notification from clients or from standard processes) as being a news-based program airing on a local broadcast affiliate of ABC, CBS, NBC or Fox. The prime news time slot includes newscasts that aired from 8 to 11 p.m. for stations in Eastern/Pacific time zones, or 7 to 10 p.m. for stations in other time zones; the midday news time slot is defined as “noon news” by Comscore and includes newscasts that aired from 11 a.m. to 2 p.m. for stations in Eastern/Pacific time zones, or 10 a.m. to 1 p.m. for stations in other time zones. Audience data for 2016 and 2017 has been updated by Comscore to provide accurate trending for local TV that aligns with the national rollup (i.e., how the average audience for local newscasts are rolled up into a figure for the U.S. overall).
Note: Numbers represent ABC, CBS, Fox and NBC affiliates for the full year and include live viewership only. “Average audience” is the average number of TVs tuned to an entity throughout the selected time frame, calculated by dividing the total hours viewed by the length of the time frame (in hours). “Local news” is defined as any telecast that has been flagged by Comscore (either by notification from clients or from standard processes) as being a news-based program airing on a local broadcast affiliate of ABC, CBS, NBC or Fox. The prime news time slot includes newscasts that aired from 8 to 11 p.m. for stations in Eastern/Pacific time zones, or 7 to 10 p.m. for stations in other time zones; the midday news time slot is defined as “noon news” by Comscore and includes newscasts that aired from 11 a.m. to 2 p.m. for stations in Eastern/Pacific time zones, or 10 a.m. to 1 p.m. for stations in other time zones. Audience data for 2016 and 2017 has been updated by Comscore to provide accurate trending for local TV that aligns with the national rollup (i.e., how the average audience for local newscasts are rolled up into a figure for the U.S. overall).
Average number of TVs tuning to news programming during each time slot for ABC, CBS, Fox and NBC affiliates
Note: Numbers represent ABC, CBS, Fox and NBC affiliates for the full year and include live viewership only. “Average audience” is the average number of TVs tuned to an entity throughout the selected time frame, calculated by dividing the total hours viewed by the length of the time frame (in hours). “Local news” is defined as any telecast that has been flagged by Comscore (either by notification from clients or from standard processes) as being a news-based program airing on a local broadcast affiliate of ABC, CBS, NBC or Fox. The morning news time slot includes any news programming that aired from 6 to 9 a.m. for stations in Eastern/Pacific time zones, or 5 to 8 a.m. for stations in other time zones; the evening news time slot is defined as “early fringe news” by Comscore and includes any news programming that aired from 4 to 7 p.m. for stations in Eastern/Pacific time zones, or 3 to 6 p.m. for stations in other time zones; the late night news time slot is defined as “late fringe news” by Comscore and includes any news programming that aired from 11 p.m. to 2 a.m. for stations in Eastern/Pacific time zones, or 10 p.m. to 1 a.m. for stations in other time zones.
Source: Comscore StationView Essentials®, 2016-2022, U.S.
PEW RESEARCH CENTER
Share this chart
Average audience for local TV key time slots
Average number of TVs tuning to news programming during each time slot for ABC, CBS, Fox and NBC affiliates
Note: Numbers represent ABC, CBS, Fox and NBC affiliates for the full year and include live viewership only. “Average audience” is the average number of TVs tuned to an entity throughout the selected time frame, calculated by dividing the total hours viewed by the length of the time frame (in hours). “Local news” is defined as any telecast that has been flagged by Comscore (either by notification from clients or from standard processes) as being a news-based program airing on a local broadcast affiliate of ABC, CBS, NBC or Fox. The morning news time slot includes any news programming that aired from 6 to 9 a.m. for stations in Eastern/Pacific time zones, or 5 to 8 a.m. for stations in other time zones; the evening news time slot is defined as “early fringe news” by Comscore and includes any news programming that aired from 4 to 7 p.m. for stations in Eastern/Pacific time zones, or 3 to 6 p.m. for stations in other time zones; the late night news time slot is defined as “late fringe news” by Comscore and includes any news programming that aired from 11 p.m. to 2 a.m. for stations in Eastern/Pacific time zones, or 10 p.m. to 1 a.m. for stations in other time zones.
Source: Comscore StationView Essentials®, 2016-2022, U.S.
PEW RESEARCH CENTER
Average audience for local TV midday and prime news
Average number of TVs tuning to news programming during each time slot for ABC, CBS, Fox and NBC affiliates
Note: Numbers represent ABC, CBS, Fox and NBC affiliates for the full year and include live viewership only. “Average audience” is the average number of TVs tuned to an entity throughout the selected time frame, calculated by dividing the total hours viewed by the length of the time frame (in hours). “Local news” is defined as any telecast that has been flagged by Comscore (either by notification from clients or from standard processes) as being a news-based program airing on a local broadcast affiliate of ABC, CBS, NBC or Fox. The prime news time slot includes newscasts that aired from 8 to 11 p.m. for stations in Eastern/Pacific time zones, or 7 to 10 p.m. for stations in other time zones; the midday news time slot is defined as “noon news” by Comscore and includes newscasts that aired from 11 a.m. to 2 p.m. for stations in Eastern/Pacific time zones, or 10 a.m. to 1 p.m. for stations in other time zones. Audience data for 2016 and 2017 has been updated by Comscore to provide accurate trending for local TV that aligns with the national rollup (i.e., how the average audience for local newscasts are rolled up into a figure for the U.S. overall).
Source: Comscore StationView Essentials®, 2016-2022, U.S.
PEW RESEARCH CENTER
Share this chart
Average audience for local TV midday and prime news
Average number of TVs tuning to news programming during each time slot for ABC, CBS, Fox and NBC affiliates
Note: Numbers represent ABC, CBS, Fox and NBC affiliates for the full year and include live viewership only. “Average audience” is the average number of TVs tuned to an entity throughout the selected time frame, calculated by dividing the total hours viewed by the length of the time frame (in hours). “Local news” is defined as any telecast that has been flagged by Comscore (either by notification from clients or from standard processes) as being a news-based program airing on a local broadcast affiliate of ABC, CBS, NBC or Fox. The prime news time slot includes newscasts that aired from 8 to 11 p.m. for stations in Eastern/Pacific time zones, or 7 to 10 p.m. for stations in other time zones; the midday news time slot is defined as “noon news” by Comscore and includes newscasts that aired from 11 a.m. to 2 p.m. for stations in Eastern/Pacific time zones, or 10 a.m. to 1 p.m. for stations in other time zones. Audience data for 2016 and 2017 has been updated by Comscore to provide accurate trending for local TV that aligns with the national rollup (i.e., how the average audience for local newscasts are rolled up into a figure for the U.S. overall).
Source: Comscore StationView Essentials®, 2016-2022, U.S.
PEW RESEARCH CENTER
Economics
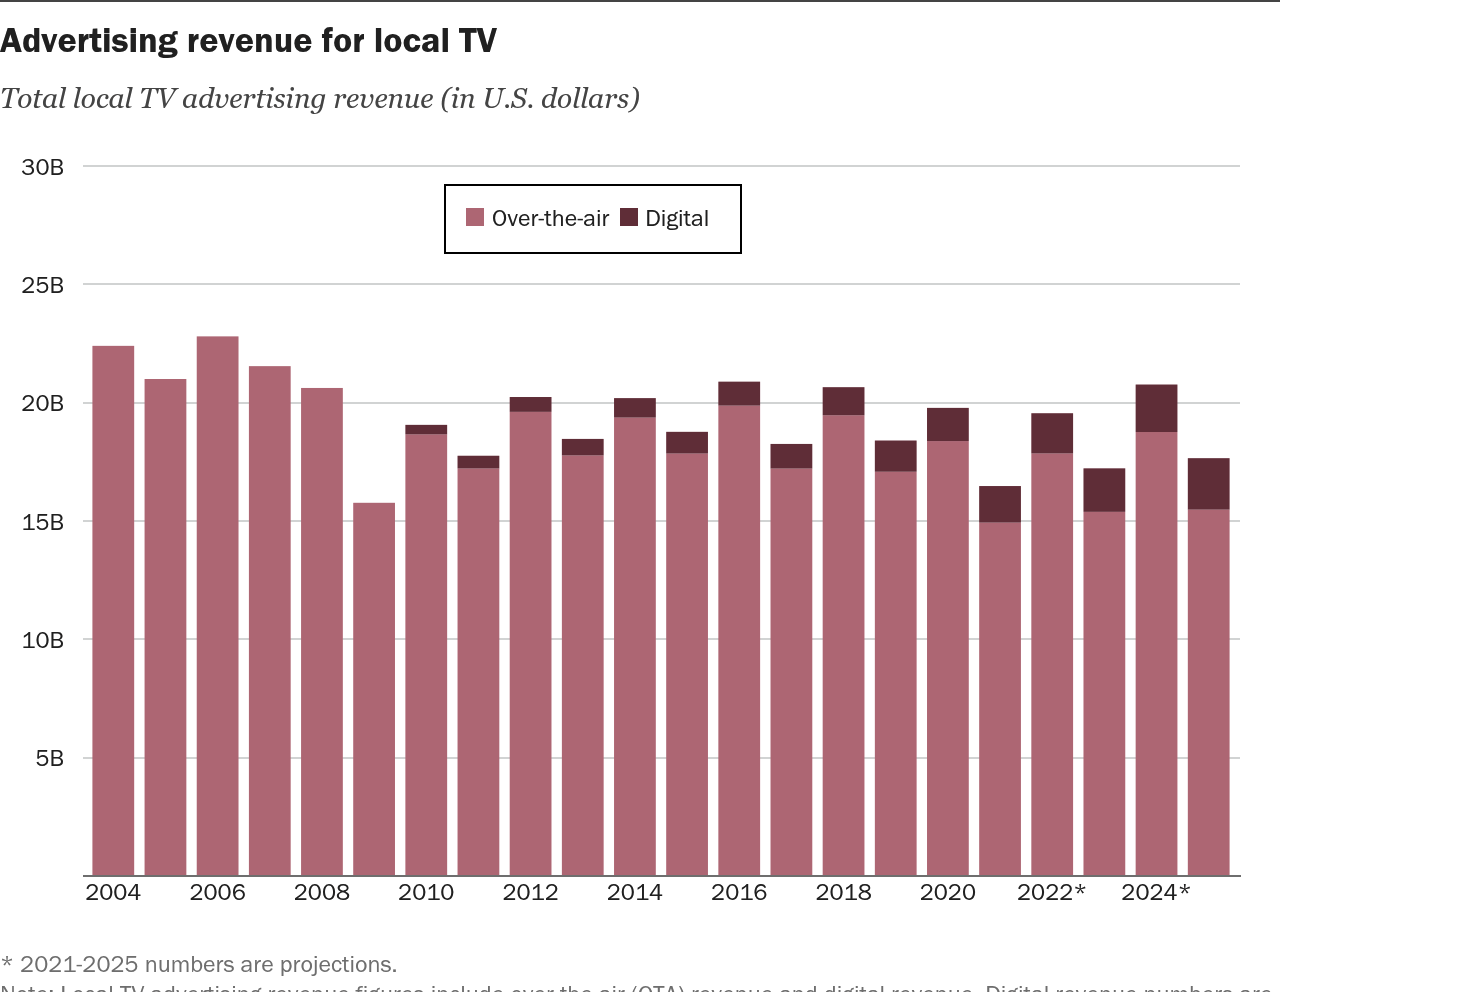
Local TV station revenue typically follows a cyclical pattern: It increases in election years and decreases in non-election years. In 2022, an election year, local TV over-the-air advertising revenue totaled $20.5 billion, a 27% increase over 2021, according to a Pew Research Center analysis of MEDIA Access Pro & BIA Advisory Services data.
Total digital advertising revenue for local TV stations increased 23% between 2021 and 2022, reaching a total of $2 billion. Digital advertising revenue accounted for 9% of total ad revenue.
Revenue for the 842 local TV stations defined as “news-producing stations” (stations that have a news director and are viable, commercial and are English-language affiliates in the U.S.) was $16.9 billion, according to the BIA Advisory Services database.
Advertising revenue for local TV
Total local TV advertising revenue (in U.S. dollars)
* 2021-2025 numbers are projections. Note: Local TV advertising revenue figures include over-the-air (OTA) revenue and digital revenue. Digital revenue numbers are not available prior to 2010. Numbers are updated annually.
Source: Pew Research Center analysis of MEDIA Access Pro & BIA Advisory Services data.
PEW RESEARCH CENTER
Revenue from retransmission fees – the fees paid by cable and satellite systems to carry local channels – has increased rapidly in the past decade, though the rate of growth has slowed in recent years, according to estimates from Kagan, a media research group within S&P Global Market Intelligence. In 2021, retransmission revenue reached $14.1 billion, up from $12.7 billion in 2020 and $11.5 billion in 2019. Kagan projects that this figure will reach $15.9 billion by 2027.
Retransmission fee revenue for U.S. local TV stations
Total retransmission fee revenue (in U.S. dollars)
* 2022-2027 numbers are projections. Note: Broadcast retransmission fees include owned and operated (O&O), affiliate station, reverse retransmissions and, starting with 2015, estimated broadcast station carriage fees from the Virtual Service Providers or vMVPDs. Numbers are updated annually.
Source: Estimates and projections by Kagan, a media research group within the TMT offering of S&P Global Market Intelligence, as of July 2022.
PEW RESEARCH CENTER
Share this chart
Retransmission fee revenue for U.S. local TV stations
Total retransmission fee revenue (in U.S. dollars)
* 2022-2027 numbers are projections. Note: Broadcast retransmission fees include owned and operated (O&O), affiliate station, reverse retransmissions and, starting with 2015, estimated broadcast station carriage fees from the Virtual Service Providers or vMVPDs. Numbers are updated annually.
Source: Estimates and projections by Kagan, a media research group within the TMT offering of S&P Global Market Intelligence, as of July 2022.
PEW RESEARCH CENTER
Five major publicly held local TV station companies – Gray, Nexstar, Scripps, Sinclair and Tegna – report political advertising revenue separately from other types of revenue in their Securities and Exchange Commission filings. In 2022, the five companies reported a total of $1.9 billion in political advertising revenue, compared with $2 billion in 2020 and $1.2 billion in 2018, the two most recent election years. (These five companies were once seven, but Nexstar purchased Media General in 2017 and Tribune in 2019.)
Political advertising revenue at local TV companies
Total political advertising revenue for five publicly held local TV station companies (in U.S. dollars)
Note: Political advertising revenue includes both local and national political advertising. Meredith was not included because it operates in a different fiscal year from the others. Data for 2012-2016 includes Media General, which was purchased by Nexstar in 2017. Data for 2012-2018 includes Tribune, which was purchased by Nexstar in 2019.
Source: Individual company Securities and Exchange Commission filings for the full year ending Dec. 31. Companies included here are: Gray, Nexstar, Scripps, Sinclair and Tegna.
PEW RESEARCH CENTER
Share this chart
Political advertising revenue at local TV companies
Total political advertising revenue for five publicly held local TV station companies (in U.S. dollars)
Note: Political advertising revenue includes both local and national political advertising. Meredith was not included because it operates in a different fiscal year from the others. Data for 2012-2016 includes Media General, which was purchased by Nexstar in 2017. Data for 2012-2018 includes Tribune, which was purchased by Nexstar in 2019.
Source: Individual company Securities and Exchange Commission filings for the full year ending Dec. 31. Companies included here are: Gray, Nexstar, Scripps, Sinclair and Tegna.
PEW RESEARCH CENTER
Newsroom investment
The average amount of weekday local TV news programming increased slightly in 2022, according to the RTDNA/Newhouse School at Syracuse University survey. Local TV stations dedicated an average of 6.6 hours to news programming per weekday in 2022, up slightly from 6.3 hours in 2021.
Number of hours dedicated to local TV news
Average number of local TV news hours per weekday
Note: Based on survey responses of news directors at all commercial local TV stations in the fourth quarter of each year among operating, non-satellite television stations.
Source: RTDNA/Hofstra University Surveys (through 2019); RTDNA/Newhouse School at Syracuse University Surveys (2020 to present).
PEW RESEARCH CENTER
Ownership
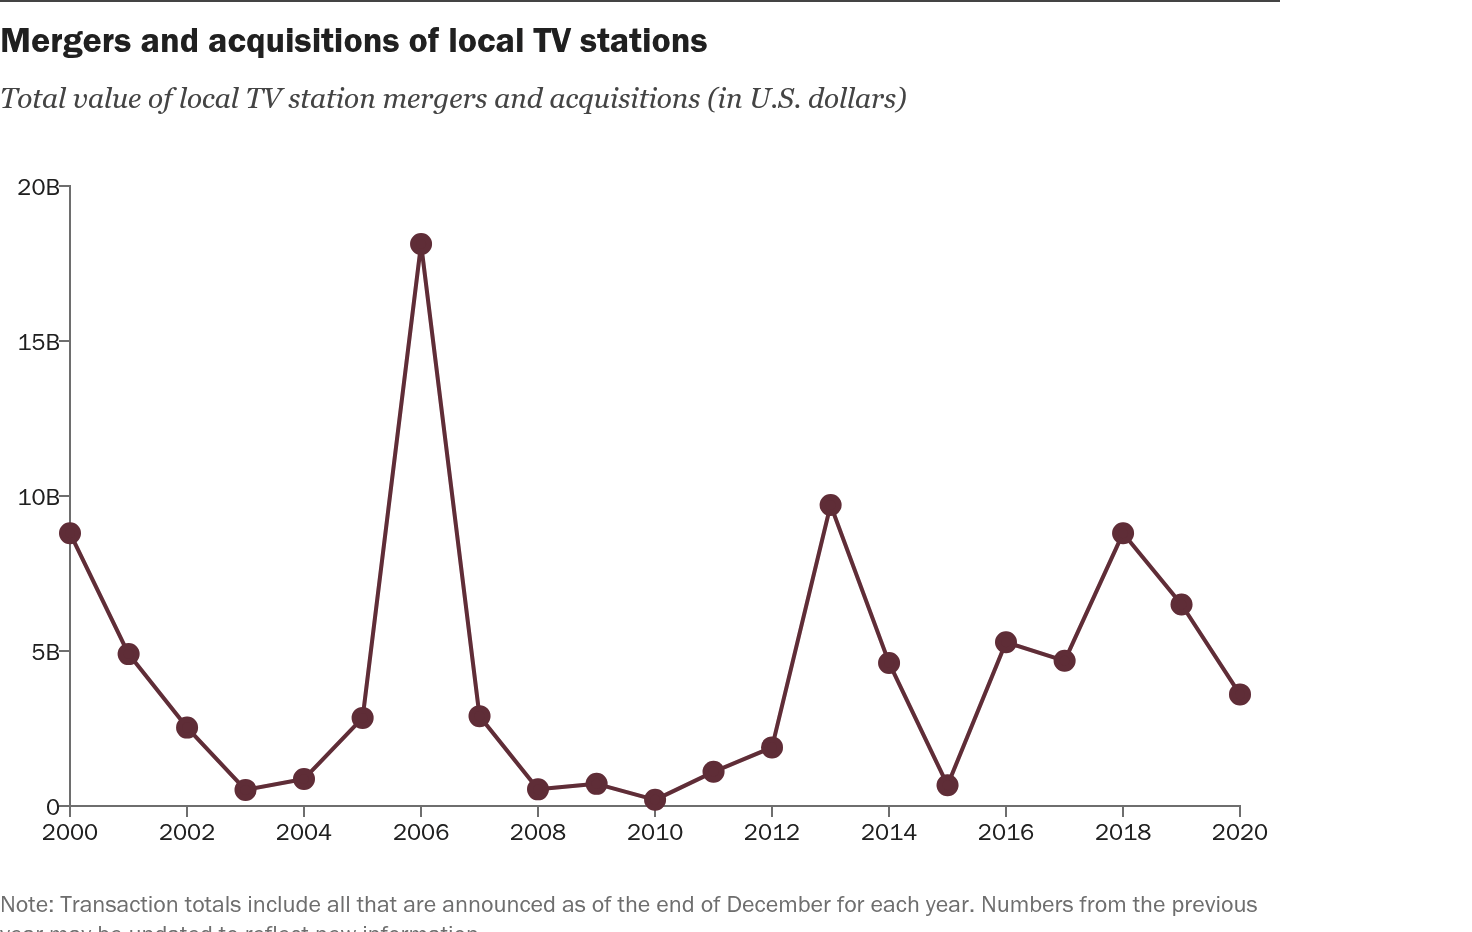
In 2022, 286 local TV stations changed hands at a cost of $6.1 billion, as annually reported by BIA Advisory Services. This is up from $3.6 billion across 175 stations that experienced changes in ownership in 2021.
Mergers and acquisitions of local TV stations
Total value of local TV station mergers and acquisitions (in U.S. dollars)
Note: Transaction totals include all that are announced as of the end of December for each year. Numbers from the previous year may be updated to reflect new information.
Source: Pew Research Center analysis of MEDIA Access Pro & BIA Advisory Services data.
Pew Research Center is a subsidiary of The Pew Charitable Trusts, its primary funder. This is the latest analysis in Pew Research Center’s ongoing investigation of the state of news, information and journalism in the digital age, a research program funded by The Pew Charitable Trusts, with generous support from the John S. and James L. Knight Foundation.
Find more in-depth explorations of local TV news by following the links below: