
The 2016 and 2020 presidential elections left many Americans wondering whether polling still works. Pre-election polls in both years struggled to capture the strength of support for former President Donald Trump and other Republican candidates.
But elections are just one of many topics that polls are used to understand. A new analysis from Pew Research Center examines the accuracy of polling on more than 20 topics, ranging from Americans’ employment and vaccination status to whether they’ve served in the military or experienced financial hardship. The analysis shows that, despite low response rates, national polls like the Center’s come within a few percentage points, on average, of benchmarks from high response rate federal surveys. The closer a poll estimate is to the benchmark, the more accurate it is considered to be. Consistent with past research, polling errors are larger for some topics – like political engagement – that may be related to a person’s willingness to take surveys.
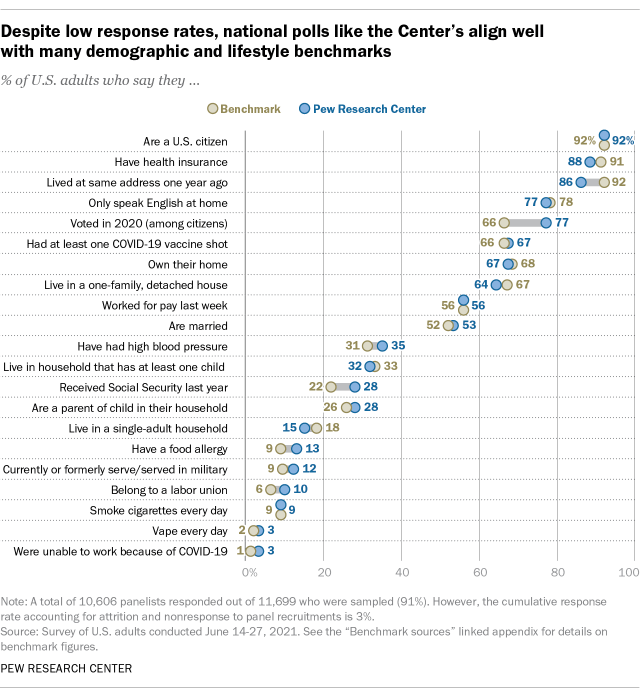
Across the 26 topics asked about in the Center’s new analysis, the poll estimates differed from the U.S. government benchmark by an average of 4 percentage points. Polling was particularly accurate for certain topics like employment, marital status and homeownership. For example, the share of U.S. adults who said they had received at least one COVID-19 vaccine dose by June 2021 was roughly two-thirds based on data from both the Centers for Disease Control and Prevention (66%) and Center polling (67%).
Pew Research Center conducted this study to assess the accuracy of its polls on 26 topics, ranging from Americans’ employment and vaccine status to whether they’ve served in the military or experienced financial hardship. For this analysis, we surveyed 10,606 U.S. adults June 14-27, 2021. Everyone who took part in this survey is a member of the Center’s American Trends Panel (ATP), an online survey panel that is recruited through national, random sampling of residential addresses. This way nearly all U.S. adults have a chance of selection. The survey is weighted to be representative of the U.S. adult population by gender, race, ethnicity, partisan affiliation, education and other categories. Read more about the ATP’s methodology. Here are the questions used for this post, along with responses, and the methodology of the ATP survey.
To assess the accuracy of the Center’s polls, we compared ATP survey estimates to data from high-quality government sources, such as the American Community Survey, the National Health Interview Survey and the Current Population Survey. The closer a survey estimate is to the government benchmark, the more accurate it is considered to be.
While not perfect, this level of accuracy is usually sufficient for getting a meaningful read of the public’s mood on key issues. Consider the recent debate over “defunding the police.” A 2021 Center poll found that 15% of U.S. adults favor decreasing spending on policing in their area. Such an estimate could be four points too high (19%) or four points too low (11%), but it still conveys the correct overarching narrative that decreasing such spending is not a broadly held view.
In a closely contested election, however, this level of accuracy is not sufficient for reliably determining the winner. It’s also important to note that, in this analysis, polling was less accurate for topics like having a retirement account, receiving food assistance and turning out to vote.
Some topics still prove difficult for polling
In many ways, results from this analysis echo past Center studies gauging the accuracy of polls. Studies in 2012 and 2017 found that, despite low response rates, polling data aligned reasonably well with high-quality government sources.
While accuracy is solid on most outcomes, this research also consistently finds that polls overrepresent people who are active in their communities or are active politically. For example, in the current analysis, about three-quarters of adults polled (77%) said they voted in the 2020 general election, while the actual rate was just two-thirds (66%).
Another polling challenge identified in this analysis concerns indicators of personal wealth or financial hardship. Out of 26 benchmarks, the largest polling error was for the share of U.S. adults who said they have a retirement account such as a 401(k), 403(b), IRA or some other account designed specifically for retirement savings. The share of adults who said they have a retirement account was overrepresented in the poll (53%) relative to their share in the population (32%), as measured by the Current Population Survey March Supplement.
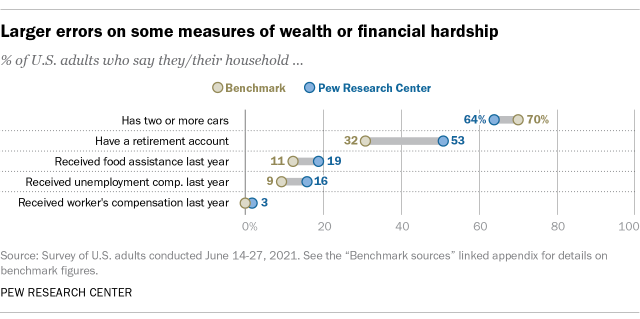
On other questions, people reporting financial hardship were overrepresented. For example, 19% of those polled reported that their household had received benefits from the Supplemental Nutritional Assistance Program (also known as the food stamp program) in 2020, but government data shows that the actual rate nationwide was lower (11%). Taken together, these results suggest that pollsters have more work to do to represent both ends of the wealth spectrum.
Implications for polling inside and outside elections
The presence of large errors on some variables is a reminder that polling is imperfect, and it is pollsters’ responsibility to investigate such errors when they arise and make efforts to correct them. That said, many professionals in business, politics, religion, education, the news media and other sectors continue to rely on polling data, despite its problems in recent elections. This study provides some evidence as to why. If a poll typically comes within a few percentage points of an authoritative benchmark, it should be able to answer questions such as, “Which issues are Americans most concerned about?” and “Do more Americans approve or disapprove of the Supreme Court’s recent ruling on abortion?”
Elections are a common way to judge the accuracy of polling. But benchmarking analyses are arguably more suitable when it comes to issue polling. One reason is that issue polls and benchmarks typically consider how all adults in the country feel about an issue. Elections, by contrast, summarize the preferences of only about 40% of the public in a typical midterm contest and about 60% of the public in a typical presidential contest – the approximate shares of eligible adults who actually vote.
Election polls also face an array of challenges that issue polls do not, including the need to predict who among those interviewed will actually vote and the risk that respondents’ stated preference for a certain candidate may change between the survey field period and election day. While errors in the 2016 and 2020 election polls are well documented, a recent Center analysis found that election polling errors are less consequential for issue polls than they might seem. Errors of the magnitude seen in some of the least accurate 2020 election polls would alter measures of opinion on issues by an average of less than 1 percentage point, the analysis found.
One limitation of this analysis is that the polling cited here comes from just one source, Pew Research Center’s American Trends Panel (ATP). But other survey panels that use the same general approach – by recruiting Americans offline and interviewing them online – provide data quality similar to the ATP.
Such surveys, however, represent just one part of the polling landscape. Many public opinion polls are still conducted by telephone using randomly-drawn samples or, even more common, are conducted online using opt-in samples. This substantial diversity in the polling field means that the results from this analysis do not necessarily hold true for any particular poll one might find. In the coming months, a Center report will provide more detail on how different types of online polls perform in this benchmarking assessment.
Assessing bias in surveys requires an objective standard to which survey findings can be compared. The benchmarks used here are drawn from government-funded surveys (or administrative data sources) that are conducted at considerable expense and with great attention to survey quality. But they are surveys nevertheless and therefore are subject to some of the same problems facing the low response rate surveys examined here.
The surveys used as benchmarks in this report have high response rates – on the order of 50% or more. Accordingly, the risk of nonresponse bias is generally thought to be lower for these surveys, though it still exists. Also relevant is the fact that all surveys, no matter the response rate, are subject to measurement error. Questions asked on government-funded surveys are carefully developed and tested, but they are not immune to some of the factors that create problems of reliability and validity in all surveys. The context in which a question is asked – the questions that come before it – often affects responses to it. Similarly, survey items may be subject to some degree of response bias, most notably “social desirability bias.” Especially when an interviewer is present, respondents may sometimes modify their responses to present themselves in a more favorable light. All of these factors can affect the comparability of seemingly identical measures asked on different surveys. Assessing the quality of data is an inexact process at best. It is therefore important to bear in mind that benchmarking provides measures of estimated bias and is highly dependent on the particular set of measures included.
Note: Here are the questions used for this post, along with responses, and the methodology of the ATP survey. Here are sources and details for the benchmarks.


