
The federal Bureau of Labor Statistics recently reported that the 10 largest occupations (as of May 2013), accounting for more than a fifth of all U.S. wage and salary jobs, are predominantly low-paid ones — cashiers, sales clerks, fast-food workers and the like. That’s broadly been the pattern in U.S. employment for many years. But overall employment has become more concentrated in those largest occupational categories over the past decade or so, and well-paying jobs account for a smaller share of them.
We examined data from the Occupational Employment Statistics program, a federal-state effort that began in its current form in the 1990s and estimates employment and pay levels for more than 800 specific occupations, from CEOs to janitors. (Self-employed Americans aren’t covered.) Each year’s estimates are derived from the most recent three-year period, for a combined 1.2 million employers.
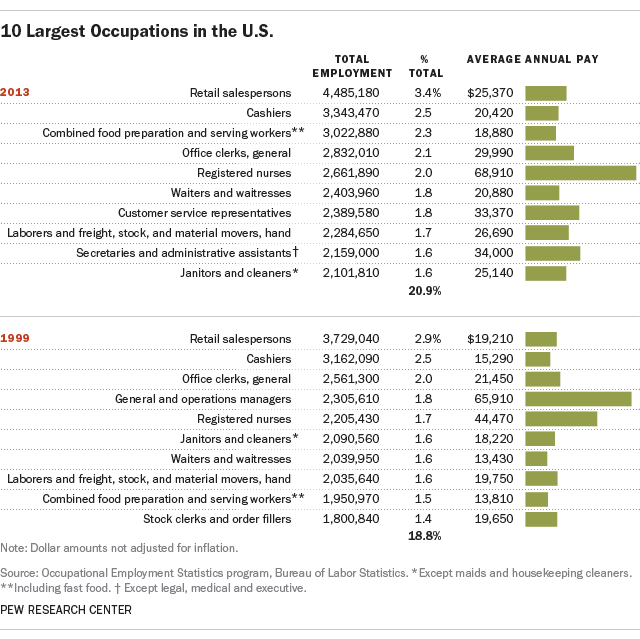
In the mid- to late-1990s, 18.8% of the nation’s 127.3 million wage and salary employees worked in one of the 10 biggest jobs; that share rose slowly but steadily through the 2000s, reaching 20.9% by last year. While most of the 10 biggest occupations were the same in both periods, there had been some notable shifts. (A caveat: Because of changes in the way occupations are defined and coded, they aren’t always directly comparable across time.)
In 1999, the highest-paying occupation among the top 10 was general and operations managers; they were, in fact, the fourth-biggest category overall, with more than 2.3 million people. By 2013, general and operations managers had fallen out of the top 10, with fewer than 2 million people, but their average annual salary nearly doubled to $116,090 compared with data from the 1999 dataset. On the other hand, combined food preparation and serving workers (a category that includes fast-food workers) numbered more than 3 million in 2013, versus 1.95 million in 1999; their average pay rose less than 40%, in nominal terms, over that time. (None of the OES pay figures are adjusted for inflation.)
The new OES data also shed some light on who would be most likely to benefit from a higher minimum wage. With economic inequality again part of the national political discussion, President Obama and other Democrats have pushed for raising the federal minimum wage to $10.10 an hour, from the current $7.25. According to the OES data, just over 13 million people (9.9% of total employment) worked in occupations in which the average hourly pay was less than $10.10. They’re overwhelmingly in food service, personal service and sales jobs.
