About four-in-ten U.S. adults (42%) say the Republican Party represents the interests of people like them very or somewhat well. A similar share (40%) say this about the Democratic Party.

But majorities say the Republican Party (56%) and Democratic Party (58%) do not represent the interests of people like them.
Combining these measures:
- 33% of adults say they feel well-represented by the Republican Party, but not by the Democratic Party.
- About as many (31%) feel represented by the Democratic Party, but not the Republican Party.
While most adults say they feel at least somewhat well-represented by at least one of the two major parties, 25% say neither party represents the interests of people like them even somewhat well. About one-in-ten (9%) say both parties represent the interests of people like them well.
How well the parties represent people’s interests
Substantial shares of Americans who identify with the Republican or Democratic parties say they feel at least somewhat well-represented by their party – though smaller shares say they feel very well-represented.
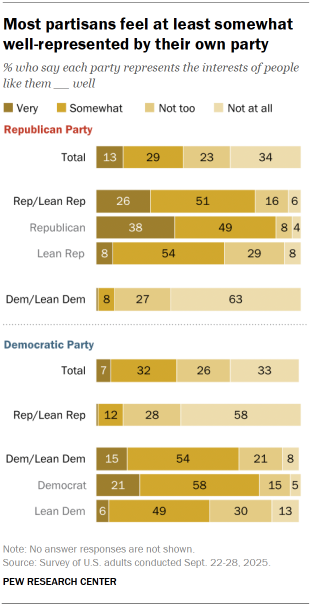
Leaners – those who don’t identify as Republican or Democrat, but say they lean towards one of the major parties – tend to be more skeptical of how well their preferred party represents their interests:
- 77% of all Republicans and Republican-leaning independents say their party represents their interests very or somewhat well.
- Those who identify as a Republican (87%) are more likely to express this view than independents who lean toward the GOP (62%).
- Nearly eight-in-ten Democrats (79%) say they feel well-represented by their party, compared with 55% of Democratic-leaning independents.
Most Americans feel represented by only one of the major parties
Two-thirds of Republicans and Republican leaners (67%) say the GOP, not the Democratic Party, represents them well. By comparison, 62% of Democrats and Democratic leaners say the Democratic Party represents people like them well, but not the Republican Party.

Democratic and Democratic leaners are more likely than Republicans and Republican leaners to say neither party represents them well (27% vs. 19%).
But in both coalitions, stronger partisans are far more likely to say they are well-represented by their party than weaker partisans or leaners.
Overall, about four-in-ten independents and those who identify with other parties (39%) say neither major party represents people like them well. But Democratic-leaning independents are more likely than Republican leaners to say this (41% vs. 32%).
Demographic differences on views of representation by both parties
Americans’ views of how well each major party represents the interests of people like them vary by gender, race, ethnicity and age.

Gender
Men are more likely to say their interests are well-represented by the Republican Party, not the Democratic Party (36%), than to say the reverse (27%).
Conversely, women are more likely to feel well-represented by the Democratic Party, but not the GOP (35%), than the reverse (30%).
Men are more likely than women to see neither party as representing their interests well (28% vs. 22%).
Race and ethnicity
About four-in-ten White adults (42%) say the Republican Party, rather than Democratic Party, represents them at least somewhat well. Far fewer (27%) say the Democratic Party, but not the GOP, represents them well.
By contrast, Black (43%), Hispanic (37%) and Asian adults (35%) are more likely to say the Democratic Party, but not the Republican Party, represents their interests well than to say the reverse.
Black (33%), Hispanic (29%) and Asian (27%) adults are also all more likely than White adults (22%) to say neither party represents their interests well.
Age
Older adults are more likely than younger adults to say they feel well-represented by the Republican Party, but not the Democratic Party. But the age difference in the shares saying they are well-represented by the Democratic Party, but not the Republican Party, is relatively modest.
Adults under 50 are considerably more likely than older adults to say neither party represents them well: 30% say this, compared with 22% of those 50 to 64, and 16% of those 65 and older.