Because partisanship and voting preference are highly correlated – and most adults stick with their preferred party over time – voter turnout is often a key factor in understanding why there are changes in electoral outcomes year to year.
In the 2024 presidential election, a higher share of Donald Trump’s 2020 voters than Joe Biden’s 2020 voters turned out to vote. Trump also won a higher share of those who had not voted four years earlier. This is different than in 2020 and 2016, when those who didn’t vote in the previous presidential election favored Democratic candidates.
Looking across multiple years, White voters, older voters, more affluent voters and voters with higher levels of formal education typically turn out at higher rates than other groups. These patterns persisted in 2024.
About this report
This Pew Research Center analysis examines voter turnout and voting preferences in the 2024 presidential election through the lens of validated voters. Validated voters are adult citizens who told us that they voted in a postelection survey and have a record showing they voted in their state’s official voter turnout records.
The postelection survey of U.S. adults was conducted Nov. 12-17, 2024, on the American Trends Panel (ATP). The ATP is a panel survey, meaning that we have interviewed many of the same respondents after each national election going back to 2016. This allows us to examine how individuals changed their turnout or candidate preferences over time. For more on how the study was conducted, read the report’s methodology. For more about terms used in the report, refer to the terminology box.
How did 2024 turnout compare with previous elections?
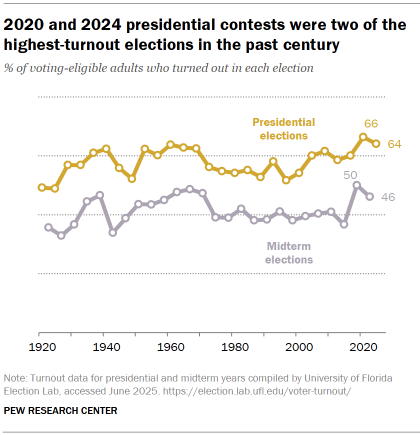
The 2020 and 2024 presidential contests were among the highest-turnout elections in the past century. The 66% turnout rate in 2020 was the highest since 1908, and 2024’s rate of 64% was the second highest, tied with 1960. The last two midterm elections also featured unusually high turnout levels, with rates not seen since the 1960s.
The spike in voter turnout is at least partly attributable to intensifying political polarization during the past decade, a period in which growing partisan antipathy has raised the stakes of election outcomes in the minds of many voters.
Which party typically benefits from high turnout?
Almost by definition, high-turnout elections mobilize more infrequent and new voters. For the past several decades, high turnout often benefited Democratic candidates, who enjoyed greater support among less-affluent, minority and young voters – groups that tend to vote at lower rates. This pattern has been weakening since 1960 but was still evident in the 2020 election.
The 2024 election was different.
New and returning voters
The 2024 Trump campaign was reported to be targeting infrequent voters. Voters in 2024 who had not turned out in 2020, but were eligible, favored Trump by a margin of 54%-42%. (Adding in the small share of voters who were too young to have voted in 2020 narrows the margin to 52%-45%.)
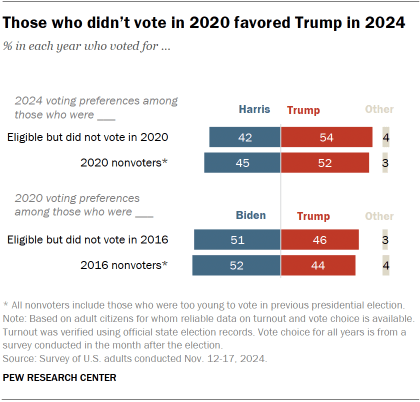
By contrast, Trump received 46% of the vote among 2020 voters who had not cast a ballot in 2016 but were eligible to do so; 51% voted for Biden. (Among all new and returning voters in 2020, including those too young to have voted in 2016, Biden led Trump by 52%-44%.)
This pattern reflects shifts in public preferences toward Trump and away from the Democratic ticket, as well as greater voter engagement among Trump supporters. Both overall and across most demographic groups in the population, Trump’s 2020 voters turned out at higher rates than Biden’s did.
Nonvoters
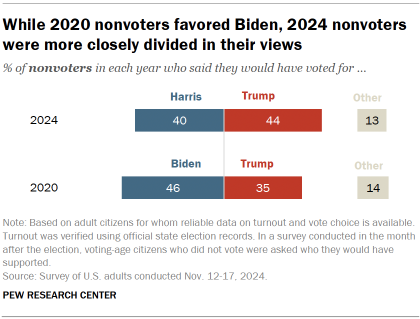
Moreover, eligible voters in 2024 who did not cast a ballot were fairly closely divided in their preferences: 44% said if they had voted, it would have been for Trump, while 40% said they would have voted for Harris. This stands in contrast to 2020, when eligible voters who didn’t vote expressed a clear preference for Biden (46% said they would have voted for Biden, 35% said they would have voted for Trump).
Turnout and the 2024 election
Among all 2020 Trump voters, 89% voted in 2024, compared with 85% among Biden’s 2020 voters. The turnout difference was larger among Hispanic voters than among many other groups: 86% of Trump’s 2020 Hispanic voters turned out in 2024, compared with 77% of Biden’s Hispanic voters.
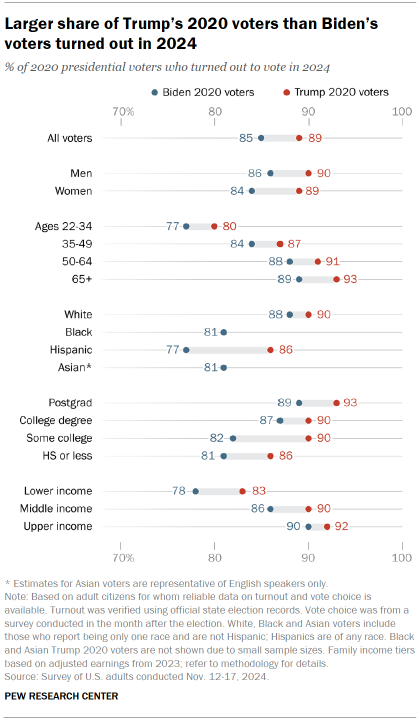
- Trump also held turnout advantages among men and women, adults 35 and older, and those with no college degree.
- In contrast, there was almost no difference in 2024 turnout among 2020 Trump and Biden voters who are White.
- And among young voters who were eligible to vote in both elections (those ages 22 to 34 in 2024), there was a 3 percentage point difference in the rate at which Biden’s 2020 voters turned out in 2024 (77%) compared with Trump’s voters (80%).
Composition of voters and nonvoters in 2024
Consistent with long-standing patterns in turnout, voters and nonvoters in 2024 differed substantially on several demographic characteristics. Compared with voters, nonvoters were younger, had lower family incomes, and were less likely to be White or to have attended college.
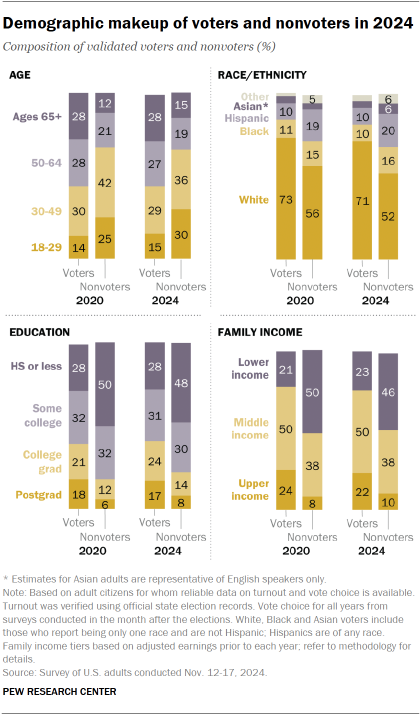
Young adults were a larger share of nonvoters in 2024 than in 2020 (30% vs. 25%). Age has long been a reliable predictor of turnout. Citizens under age 30 constituted only 15% of all voters in 2024, considerably below their share of the age-eligible population (20%).
Almost half of nonvoters (48%) had only a high school education or less, compared with 28% among voters. College graduates made up about twice the share of voters (41%) as nonvoters (22%).
Non-Hispanic White adults made up a larger share of voters than nonvoters in 2024, though the share who were voters declined slightly from 73% in 2020 to 71% in 2024. White adults were also a smaller share of nonvoters in 2024 than in 2020, reflecting the steady growth of the non-White population in the U.S.
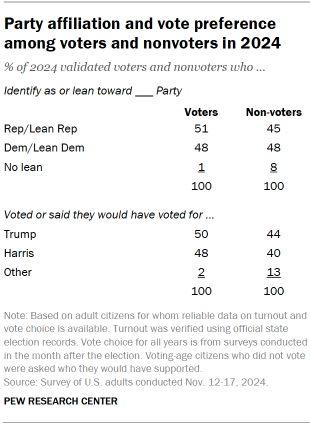
In 2024, nonvoters were split in their preferences between Trump and Harris. They were also closely divided in their partisan affiliation. In both 2016 and 2020, nonvoters preferred the Democratic candidate and leaned Democratic in party affiliation. In 2024, nonvoters were more closely divided on both candidate preference and party affiliation: 44% of nonvoters preferred Trump and 40% preferred Harris. And 48% identified with or leaned toward the Democratic Party, while 45% identified as or leaned Republican. More nonvoters identified as or leaned Democratic (48%) than said they would have voted for Harris (40%).
Patterns of turnout across recent elections
Most Americans are not regular voters. Even across the three most recent national elections, which featured higher-than-normal turnout, just 41% of adult citizens who were old enough to vote cast a ballot in all three. About one-in-four (26%) did not vote in any of them.
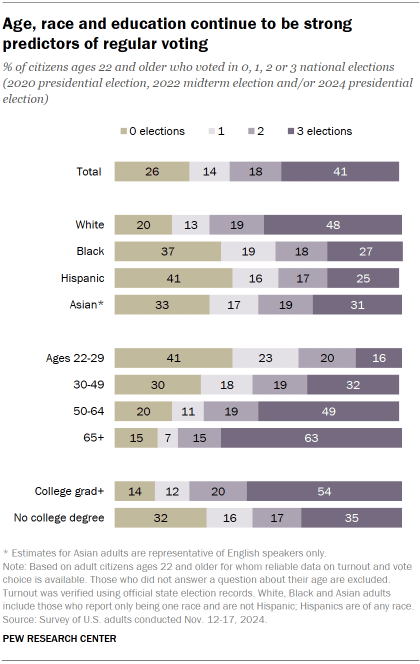
All of the demographic differences between voters and nonvoters seen in the 2024 election are magnified when looking at turnout patterns across multiple elections.
Almost half of non-Hispanic White adult citizens (48%) voted in all three elections, compared with 27% of Black adults and 25% of Hispanic adults. Hispanics are about twice as likely as White adults to have not voted at all in these three elections (41% for Hispanics, 20% for White adults).
As a consequence of this pattern, regular voters skew White: Among those who voted in all three elections, about three-quarters are non-Hispanic White, compared with just 50% among those who did not vote in any election.
Frequent voters are much older than infrequent voters. Among those 65 and older, 63% voted in all three elections. Young adults are especially likely to have sat out multiple elections: Just 16% of those old enough to have voted in all three actually did so, and 41% didn’t vote in any of them.
Those with greater educational attainment vote more frequently. More than half of college graduates (54%) voted in all three national elections between 2020 and 2024. Only 35% of those without a college degree did so.
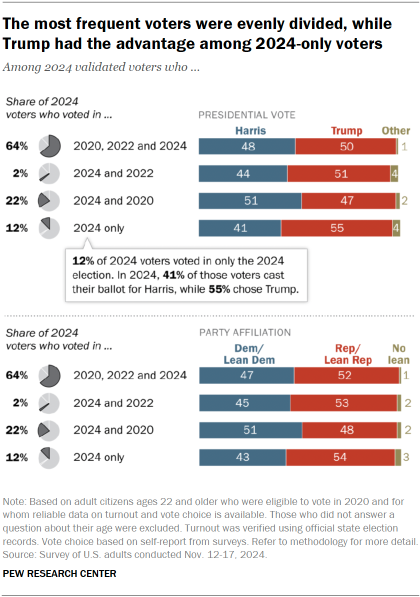
Trump held a clear advantage among those who voted in 2024 but stayed home in 2022 and 2020. Most striking is that those who only voted in the 2024 presidential election – but were eligible to vote in 2020 and 2022 – were the most supportive of Trump. He carried this group by 55%-41%. These voters constituted 12% of 2024 voters.
Slightly more than one-fifth (22%) voted in the presidential elections of 2020 and 2024, but not the 2022 midterms; Harris had a narrow edge among these voters (51%-47%).
The 64% of 2024 voters who turned out in all three elections were closely divided between the candidates (50% for Trump, 48% for Harris).


