
The composition of Republican and Democratic voters in the United States has changed since the 2020 presidential election, and the shifts have been even larger since the 2016 contest.
Donald Trump’s voters overall were more racially and ethnically diverse in 2024 than in his prior campaigns, reflecting gains among Hispanic, Black and Asian voters. Conversely, Kamala Harris’ voters were somewhat less diverse than the voters who backed Joe Biden in 2020 or Hillary Clinton in 2016.
Despite these changes, there continue to be wide differences in the makeup of the partisan coalitions.
Trump voters were less racially and ethnically diverse, older and less likely to have a four-year college degree than Harris voters. And the sizable religious differences between those who voted for Republican and Democratic candidates persisted: Roughly eight-in-ten Trump voters (79%) identified as Christian, compared with about half (52%) of Harris voters.
About this report
This Pew Research Center analysis examines voter turnout and voting preferences in the 2024 presidential election through the lens of validated voters. Validated voters are adult citizens who told us that they voted in a postelection survey and have a record showing they voted in their state’s official voter turnout records.
The postelection survey of U.S. adults was conducted Nov. 12-17, 2024, on the American Trends Panel (ATP). The ATP is a panel survey, meaning that we have interviewed many of the same respondents after each national election going back to 2016. This allows us to examine how individuals changed their turnout or candidate preferences over time. For more on how the study was conducted, read the report’s methodology. For more about terms used in the report, refer to the terminology box.
Racial and ethnic composition of Harris and Trump voters in 2024
The racial and ethnic composition of voters shifted only modestly over the past three elections, though the share of voters who are White and not Hispanic continued to tick lower. White voters made up 71% of all voters last year, down from 73% in 2020 and 74% in 2016.
Related: Explore long-term changes in the composition of registered voters in our report “Changing Partisan Coalitions in a Politically Divided Nation.”
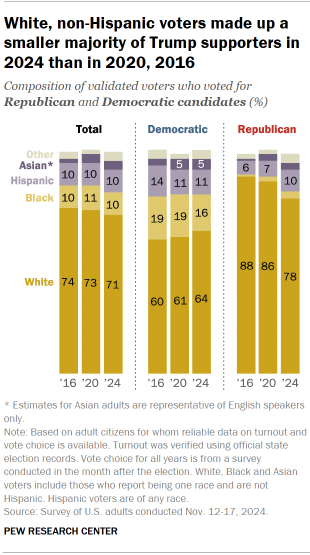
White non-Hispanic adults continued to make up a large majority (78%) of voters who supported Trump. However, this represents the lowest share in the past three presidential elections. White voters made up 86% of Trump’s coalition in 2020 and 88% of Trump voters in 2016.
Another 10% of Trump voters were Hispanic, while 3% were Black and 3% were Asian. The share of Trump voters who are Hispanic, Black, Asian or another race has roughly doubled since his 2016 election, from 11% to 20%, mostly because Hispanic voters now make up a larger share of his voters (10%, up from 6% in 2016).
Among Harris voters, 64% were non-Hispanic White, slightly higher than the share of Biden (61%) or Clinton voters (60%) who were White.
Among Harris voters, 16% were non-Hispanic Black, while another 11% were Hispanic. Asian adults accounted for 5% of Harris’ voters.
Educational composition of 2024 voters
About six-in ten voters in 2024 (59%) did not have a college degree. This share has steadily decreased over time as the share of Americans with a college degree has grown (in 2016, 63% of voters did not have a college degree).
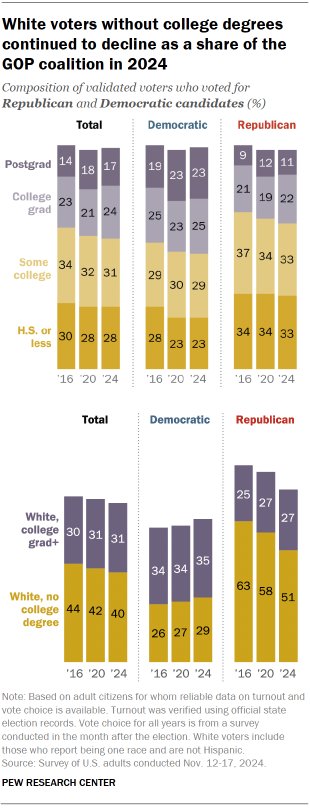
Overall, those who voted for Democratic candidates in recent elections have been more likely than Republican voters to have a college degree.
Harris voters were about evenly split between those who do have a college degree (48%) and those who do not (51%). The share of Democratic voters who have a college degree has risen somewhat since 2016, when 43% had a degree.
Among Trump’s 2024 voters, two-thirds (67%) did not have a college degree, down slightly from 71% in 2016.
However, the share of Republican voters who are White and have no college degree has substantially declined since 2016.
In 2024, White noncollege voters made up a narrow majority (51%) of Trump’s coalition. That is the smallest share in his three campaigns for the White House:
- In 2020, 58% of Trump voters were White adults who did not have a four-year degree;
- In 2016, more than six-in-ten Trump voters (63%) were White, noncollege voters.
There has been less change in the share of Democratic voters who are White with no college degree (29% in 2024 vs. 27% in 2020 and 26% in 2016). As was the case for Biden and Clinton supporters, White college graduates made up a larger share of Harris supporters (35%) than did White voters who did not have a college degree (29%).
Age composition of 2024 voters
The age distribution of voters in 2024 was roughly the same as it was in the last two presidential elections. Overall, a majority of voters (56%) were ages 50 and older, while 44% were under the age of 50.
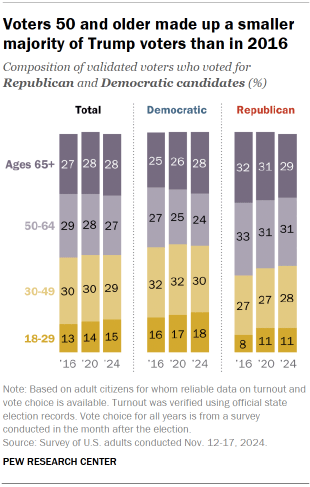
Younger voters continued to make up a somewhat larger share of the Democratic coalition than the Republican coalition, but voters under the age of 50 made up a larger share of Trump’s coalition in 2024 than in 2016.
Among Democratic voters:
- 52% of Harris voters were ages 5o and older, while 48% were younger than 50.
- These numbers are similar to Biden and Clinton’s coalitions.
Among Republican voters:
- 60% of Trump voters were 50 and older in 2024, down from 65% in 2016.
- Voters under 50 made up 40% of Trump’s coalition in 2024, up from 35% in 2016.
Rural, suburban and urban composition of 2024 voters
The community profiles of Harris and Trump voters have not fundamentally changed since 2020.
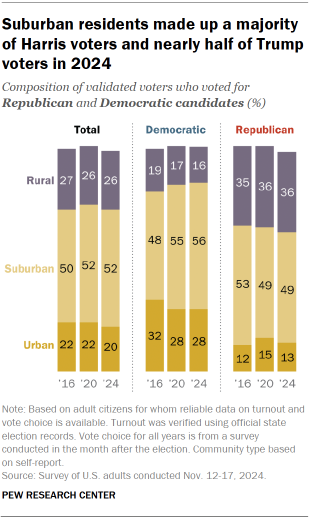
Suburban voters made up the largest shares of both Harris (56%) and Trump (49%) voters in 2024. And while Harris voters were much more likely than Trump voters to describe their communities as urban (28% vs. 13%), rural voters made up a substantially larger share of Trump voters (36%) than Harris voters (16%).
Religious composition of 2024 voters
Overall, the religious composition of voters has shifted modestly since 2016. In 2024, roughly four-in-ten voters (43%) were Protestants, while about a quarter were religiously unaffiliated and 20% were Catholics. In 2016, Protestants made up 47% of voters.
Protestants again made up a majority of Trump voters (54%) in 2024, compared with 32% of Harris voters. The share of Protestants making up each coalition has dipped slightly since 2016.
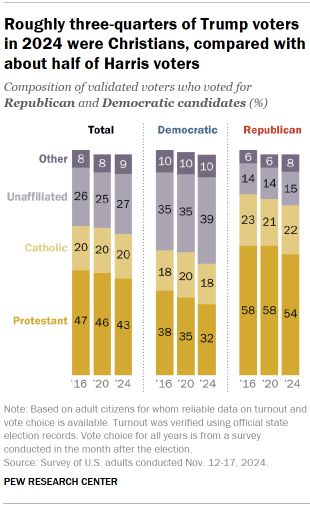
Religiously unaffiliated voters (atheist, agnostic and those who describe themselves as “nothing in particular”) made up a much larger share of Democratic voters than Republican voters (39% vs. 15%).
Religiously unaffiliated voters were a slightly larger share of Harris voters (39%) than Biden or Clinton voters (35% each).
Catholics made up about one-in-five Trump voters (22%) and a slightly smaller share of Harris voters (18%).
White Protestants made up a smaller share of Trump’s coalition in 2024 than they did in 2020 and 2016. In 2024, fewer than half of Trump’s voters (43%) identified as White evangelical (29%) or nonevangelical Protestant (15%). That is lower than in 2020 (51%) or 2016 (52%).
Black Protestants continued to make up a larger share of the Democratic coalition than the Republican coalition (12% vs. 2%). The share of Trump’s coalition that was made up of Protestants whose race or ethnicity is something other than White or Black has grown since 2020. In 2024, these voters made up 9% of Trump’s voters, up from 5% in 2020.


