This report is based on respondents to a self-administered web survey conducted between Nov. 29 and Dec. 12, 2016, who were matched to at least one of five different commercial voter file databases. This includes 3,014 individuals who were validated as having voted in the 2016 general election and 756 who were classified as nonvoters. Respondents were members of Pew Research Center’s American Trends Panel, a nationally representative panel of randomly selected U.S. adults recruited from landline and cellphone random-digit-dial surveys. Panelists participate via monthly self-administered web surveys. Panelists who do not have internet access are provided with a tablet and wireless internet connection. At the time of the Nov. 29-Dec. 12, 2016 survey, the panel was managed by Abt, and it is currently being managed by GfK.
An effort was made to match the panelists to five commercially available databases that contain information about voter registration and turnout for nearly every U.S. adult. In total, 91% of panelists were located in at least one of the files. Panelists who were verified as having voted in at least one of the commercial voter databases were considered to be validated voters and are included in the tabulations here. Panelists for whom no turnout record was located were considered to be nonvoters. Details about the validation process are discussed in a more general report about commercial voter files published in February 2018, “Commercial Voter Files and the Study of U.S. Politics.”
The resulting sample of verified voters mirrored the election results very closely. After the validation was done and the sample was limited to those for whom a turnout record could be located, 48% reported voting for Hillary Clinton and 45% for Donald Trump; by comparison the official national vote tally was 48% for Clinton, 46% for Trump.
No one survey is perfect, and like others this one is subject to error. But a number of features may help to bolster its value as a source of information about who participated in the election and for whom they voted. First, the panel is based on a probability sample of the U.S. public and is weighted to correct for nonresponse and other biases. Second, vote preference was gathered using a self-administered survey, minimizing the risk that respondents might decline to answer. Third, the interviews were conducted within about a month of the election, reducing the potential for memory errors or subsequent political events to affect recall of candidate preference. In addition, pre-election vote preferences from a survey conducted with the same set of respondents are largely consistent with this post-election analysis. Fourth – and perhaps most important – the survey did not use self-reported turnout but rather made an extensive effort to validate whether each respondent actually voted in the election. Unlike other studies that have employed vote validation, this one employed five different commercial voter files in an effort to minimize the possibility that actual voters were incorrectly classified as nonvoters due to errors in locating their turnout records.
For full details about the voter file matching and voter verification process, see the February 2018 report.
See topline from “In Election’s Wake, Partisans Assess the State of Their Parties,” December 20, 2016 for full wording of the questions used in this analysis.
The following table shows the unweighted sample sizes and the error attributable to sampling that would be expected at the 95% level of confidence for different groups in the survey:
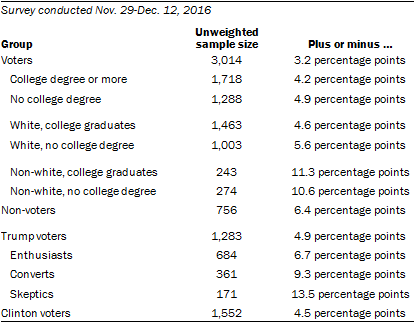
Sample sizes and sampling errors for other subgroups are available upon request.
In addition to sampling error, one should bear in mind that question wording and practical difficulties in conducting surveys can introduce error or bias into the findings of opinion polls.
About the missing data imputation
Participants in the American Trends Panel are sent surveys to complete roughly monthly. While wave-level response rates are relatively high, not every individual in the panel participates in every survey. The analyses of sentiment of 2016 voters at different time points in this report are based on four surveys fielded in April 2016, September 2016, November 2016 and March 2018.
Of the more than 3,000 respondents who participated in the November 2016 wave and were validated as having voted in the 2016 election, several hundred respondents (16% overall) did not respond to at least one of the other waves. A statistical procedure called multiple imputation by chained equations was used to guard against the analysis being undermined by this wave level nonresponse. In particular, there is some evidence that those who are most likely to participate consistently in the panel are more interested and knowledgeable about politics than those who only periodically respond. Omitting the individuals who did not participate in every wave of the survey might introduce bias into the sample.
The particular missing data imputation algorithm we used is a method known as multiple imputation by chained equations, or MICE. The MICE algorithm is designed for situations where there are several variables with missing data that need to be imputed at the same time. MICE takes the full survey dataset and iteratively fills in missing data for each question using a statistical model that more closely approximates the overall distribution with each iteration. The process is repeated many times until the distribution of imputed data no longer changes. Although many kinds of statistical models can be used with MICE, this project used classification and regression trees (CART). For more details on the MICE algorithm and the use of CART for imputation, see:
Azur, Melissa J., Elizabeth A. Stuart, Constantine Frangakis, and Philip J. Leaf. March 2011. “Multiple Imputation by Chained Equations: What Is It and How Does It Work.” International Journal of Methods in Psychiatric Research.
Burgette, Lane F., and Jerome P. Reiter. Nov. 1, 2010. “Multiple Imputation for Missing Data via Sequential Regression Trees.” American Journal of Epidemiology.