
Among the most important data on the voter files for the election analyst are the records for whether or not someone is registered to vote and whether they voted in a given election. These individual registration and turnout records come directly from records kept by each state for every election. The turnout record indicates whether or not someone voted in a given election, though it does not provide their chosen candidate or party. The registration record may include which political party the individual is registered with (in states where voters can register by party). When combined with other data in the voter file, it is possible to create a rich picture of who is registered and who showed up to vote in previous elections.
In addition, while an individual’s vote history is readily available through the official voter records in all 50 states and the District of Columbia, commercial voter files typically offer scores for things like partisanship and expected turnout for future elections generated through predictive models. This chapter will explore the availability and accuracy of political data on voter files, both raw and modeled.
Vote history is largely consistent across the files
Election analysts greatly value the availability of turnout records for past elections. Being able to document turnout in different types of elections (e.g., presidential years and off-years) enables researchers to better understand how voters differ in motivation and resources to participate. It is, of course, possible to ask survey respondents about voting in past elections. But pollsters recognize that memories about events that occurred two or four years ago (or longer) are potentially faulty, especially for respondents who are not especially interested in politics. Thus, having accurate turnout records for individuals is an important asset of the commercial voter files. Even with direct access to state voter files, a researcher may not be able to document an individual’s past voting behavior if they have changed their state of residence during the period of interest.
One important caveat to consider with vote history is that, while the presence of a record of voting almost certainly means that a person voted in that election, the absence of a record doesn’t mean they definitely did not vote. The lack of a record could indicate that someone did not vote, that the matched data has missed one or more election records for an individual or even that the match is to the wrong person. Even when the match is to the correct person, the voter record attached to that person in the commercial file may be out of date or otherwise incorrect.
The situation is even more ambiguous for individuals who are not matched to a voter file. Since voter files are built on a base of official state records and subsequently expanded with non-official commercial records, the absence of a match may indicate that the individual does not have a state registration or voter record where he or she currently lives. This could imply that he or she is not registered and therefore probably did not vote in recent elections. But this cannot be said for sure, since failures to match can occur even when a state record exists (for reasons discussed earlier).
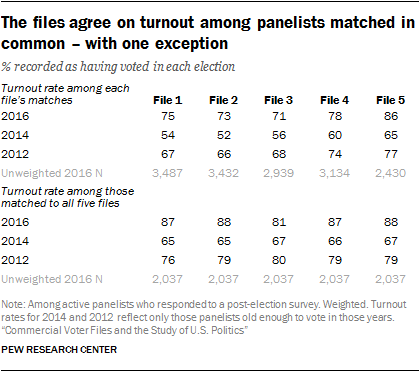
In assessing turnout for the 2016 presidential election, there tends to be a fairly high degree of agreement among the files on an individual’s vote history. This is likely because all the vendors draw from the same state voter files as raw source material. This is especially the case for four of the five files, which produce relatively similar turnout rates. Estimates in File 1 through File 4 range from a low of 71% who are listed as having voted in 2016 to a high of 78%. However, File 5 exists as an outlier. As the file with the lowest match rate, File 5 produces the highest estimate for turnout in 2016, at 86%. While these turnout rates are in line with self-reported turnout on the American Trends Panel, the turnout rates here are considerably higher than the known turnout rate in each election. However, as noted in Chapter 2, politically engaged respondents are more likely than less engaged respondents to be matched to the voter files. This leads to higher estimates for turnout in each election.
To eliminate the variation in turnout rates produced by differences in match rates across vendors, the turnout rates were computed for the roughly four-in-ten (42%) panelists who were matched by all five files. Among these panelists, 85% have identical turnout records across the five files (75% are recorded as having voted in all five and 10% have no record of a vote in all five). At the aggregate level, turnout was 87% to 88% in four of the five files, but is 7 points lower in File 3 (81% turnout). The reason for this exception is unclear.
As with turnout in 2016, the vendors vary somewhat in their rates of voting for 2012 and 2014. However, when restricting to the common set of matches between all five vendors, most of the variability is eliminated (as it was for 2016): Turnout estimates for 2014 vary between 65% and 67%, and for 2012, between 76% and 80%. In this analysis, File 3 does not stand out as exceptional, as it did with the 2016 vote.8
The fact that turnout rates for 2012 are considerably lower than for 2016 illustrates the difficulty of accurately tracking voting records over time, even for organizations that have made it a very high priority to do so. The actual turnout rate among voting-eligible adults for 2016 is estimated at 60%, while the 2012 rate is just 1 point lower (59%). And yet, the 2016 turnout rate for the panelists exceeded the 2012 rate by margins of 3 to 9 points across the five files. It is clear that vote histories get lost as people move or change names, despite the best efforts of vendors to build a complete history for those in its files.
Survey error in reported turnout
One of the most common challenges facing survey research about elections is the tendency for some people to say they voted when they did not. This phenomenon has received extensive academic attention, and much of the research has relied upon surveys matched with validated voter turnout data. For many people, voting is a socially desirable behavior because it conforms to traditional notions of civic duty. Accordingly, there may be pressure for people to claim they voted even when they did not. Previous research has documented that the incidence of misreporting turnout is higher among people who value political participation and, as a group, may already have higher rates of turnout. Voter files have greatly aided researchers’ understanding of error in the measurement of voter turnout.
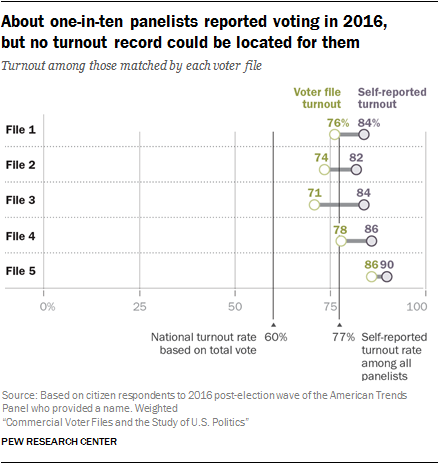
As expected, the rate of self-reported turnout in 2016 exceeded the voter file estimates among matched panelists in all five voter files. The overestimate of turnout ranged from 4 percentage points in File 5 to 13 points in File 3.
Yet unlike most studies that have examined overreporting of voting, which typically use a single source of voter validation, Pew Research Center has five sources for evidence of turnout and thus can be more confident that failures to match or errors in record-keeping by a single source might lead to erroneous conclusions about an individual’s turnout. If researchers are confident of the accuracy of the matches for an individual, a record in one file that they voted is strong evidence even if other files provide no record of voting.
Panelists were interviewed shortly after the 2016 election about their participation in the election and asked whether and for whom they voted. The self-reported turnout rate among panelists (restricted to citizens) was 77% (weighted) – 17 percentage points higher than the estimated turnout rate among the entire voting-eligible population.
This overestimate of turnout is likely a consequence of three different factors. One is (as discussed above) misreporting by respondents, driven by the desire to appear more engaged or perhaps by a respondent’s impression of one’s self as a dutiful citizen who usually votes. Another is that the survey’s sample includes people who are more politically engaged than the typical American. The third is that being surveyed, and especially being in a panel with regular surveys, might stimulate a respondent’s interest in politics and potentially motivate them to vote. Warren Miller, a renowned political scientist who was a coauthor of the seminal research on elections, “The American Voter,” once said that the American National Election Study was “the most expensive voter mobilization project in American history” because it appeared to have motivated many of its respondents to vote when they might otherwise have not done so.
The voter files provide excellent evidence about the first of these explanations – misreporting by respondents. Self-reports of turnout can be compared with the verified record of voting to estimate the extent of overreporting and the characteristics of those who overreport. To do this, researchers used a composite estimate of turnout based on records in all five files. If any file included a record of turnout for the panelist, it was assumed that the panelist voted, even if other files did not find a voter record. If a matched panelist had no record of voting in any file, that person was considered a nonvoter. But because there were five vendors looking for panelists, researchers made the additional assumption that unmatched panelists were also nonvoters. The validity of this assumption depends on the accuracy of the matches. Consequently, before implementing this step, researchers evaluated the quality of the matches by comparing the name and address of each panelist with the name and address on the voter file record that matched to it. Matches judged to be possibly incorrect because of inconsistencies in the name or address were considered unmatched for purposes of this analysis.9
To review, if any file included a record of turnout for the panelist, it was assumed that the panelist voted, even if other files did not find a voter record. All other panelists were considered to be nonvoters. This is based on the fairly strong assumption that panelists who could not be located and verified as a voter in any official voter file by five different commercial vendors can be assumed to have not voted.
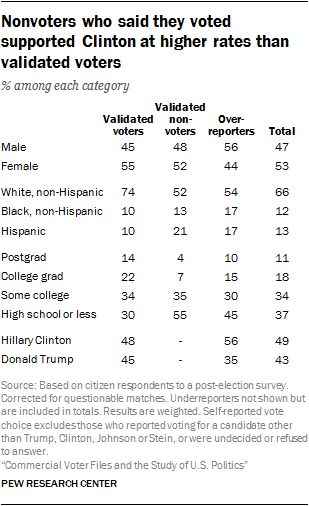
Using this approach, the voter file verified turnout rate among the panelists was 65%, 5 percentage points higher than the best estimate of national turnout among eligible adults. One percent among the 65% are panelists who said they didn’t vote but have a record of doing so. This small group of fewer than 20 individuals may have accidentally selected the wrong option on the survey, or there could be an error in the official turnout record. About one-in-five panelists (22%) are validated nonvoters (respondents who said they didn’t vote and for whom no record of voting exists).
The remaining group consists of the overreporters. These are the 12% of all voting-eligible adults (citizens who are 18 years of age or older) who said they voted but for whom no record can be located across five voter files. Demographically, these individuals are more male than female (56%-44%), disproportionately black and Hispanic (17% each, compared with about 10% each among validated voters), much more Democratic than Republican in party affiliation and more supportive of Hillary Clinton than Donald Trump (56% Clinton, 35% Trump vs. 48% to 45% among verified voters). They are much more likely than validated nonvoters to say they “always” vote (44% vs. 5%) and that they follow what’s going on in government and politics most of the time (36% vs. 13%).10
Having a validated measure of who voted and who did not makes it possible to assemble a more authoritative portrait of the electorate in 2016. As post-election analysis has demonstrated, the composition of the 2016 electorate is important in understanding Donald Trump’s 2016 election victory, and – more broadly – what kinds of changes may be occurring in the U.S. political system.
Analysts have generally relied upon three main sources of data on who votes. One is the National Election Pool’s (NEP) exit poll, which provides estimates of the voting patterns among different groups in the population. Another is the U.S. Census’ Current Population Survey (CPS) supplement on voter registration and turnout, conducted shortly after the general election. A third is the set of independent surveys such as the American Trends Panel and the American National Election Study.
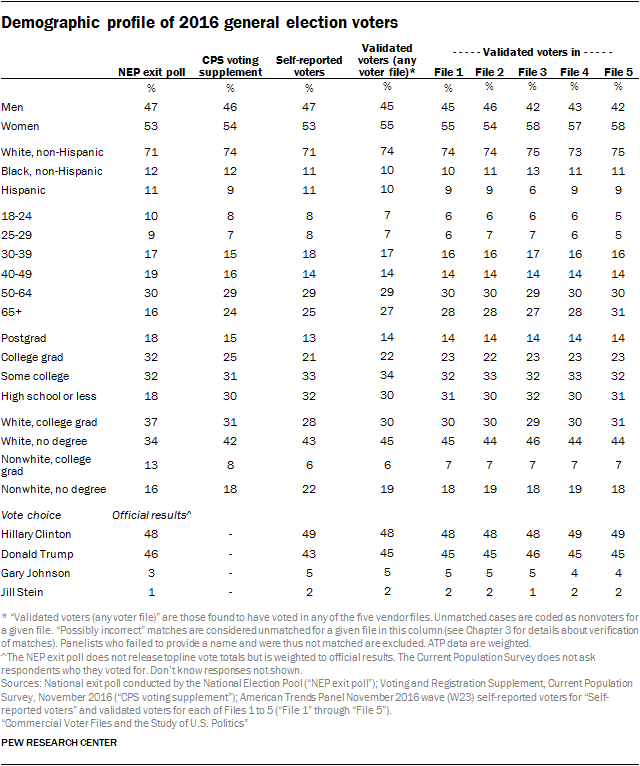
The NEP’s exit poll has been criticized for overrepresenting younger, college educated individuals and minorities. The CPS survey finds an electorate that is less educated and more likely to be white, as do many independent surveys.
The American Trends Panelists who self-identify as having voted in 2016 looks very much like the CPS electorate, especially with respect to the critical category of non-college whites. The ATP sample of self-reported voters is 43% non-college white, about the same as in the CPS survey, and just 34% in the exit poll. But the ATP self-reported voters supported Hillary Clinton by a six point margin, 49% to 43%. Restricting the sample to those who are validated as having voted in at least one of the voter files does not change the composition of the sample very much (though the share of white non-Hispanic voters rises from 71% to 74%), but the vote margin now approximates the actual election result, 48% Clinton to 46% Trump.
Using just the matches in each of the voter files produces similar results with respect to the horse race. Compared with reported vote choice among all matched panelists in each file who said they voted, the Clinton advantage over Trump among validated voters in each file was narrower. Clinton’s advantage varies from 2 to 4 points across the five files (versus 3 to 6 points among all self-reported voters matched by in each file).
Self-reported voter registration status is murkier than voter turnout
Compared with voter turnout, voter registration is a much more problematic measurement issue for survey researchers. The fact that voter registration is a status rather than an activity means it is something that can be difficult to remember accurately. For one, the typical person registers to vote much less often than they turn out to vote. For people who vote rarely or never, their registration is largely an abstraction – an administrative status maintained by their state’s election authority without input from the individual. If someone registered to vote nine years ago but hasn’t voted in five, are they still registered to vote? Without a call to the local election office, it would be hard for them to know.
In addition, there are a number of different ways states handle their voter registration databases. For example, states periodically clean voter registration data, either because someone is believed to have moved or they have not voted over a period of time. So if a voter stays at the same address for many years and is able to maintain their registration, either through periodic voting or because their state allows registrants to remain on the file without voting or confirming their continued residence, their most recent act of registration is long in their past. This adds a source of error for voters answering questions about their registration in that they may simply not know with certainty if they are registered.
The abstraction of voter registration in a survey respondent’s mind, however, does not mean that his or her voter registration cannot be validated. If a state voter file contains a record of the respondent at their current address, then the respondent is definitely registered to vote. After all, the state voter file is the authoritative source of data used on Election Day to check in voters.
Ambiguities occur when a voter claims to be registered but no record matching their current address can be found on the voter file. The lack of a matching record is not proof that the person is not registered. In some localities, voters who have moved can vote as long as they haven’t changed voting districts. Others may choose to vote in their old precinct, using the registration attached to their previous address. College students are able to vote in some states where they attend school, but that may not reflect their permanent address.
Another possibility for why voters who report being registered do not have a corresponding record is that the respondent was not able to be matched to the commercial voter file at all. This could be due either to errors on the voter file or in the personally identifying data provided by the respondent, preventing an otherwise valid registration from being found. In light of these possibilities, care should be taken when assessing the registration status of seemingly unregistered respondents.
Survey error in reported registration
The problematic nature of measuring voter registration is evident in the mismatch between the voter file data and responses from the American Trends Panel participants. Panelists are asked periodically about their registration status using the three-category question described earlier in the report. Survey responses about registration were compared with registration status from the voter files. For the purpose of this analysis, due to the complicated nature of voter registration as discussed above, survey respondents with possibly incorrect matches were flagged as unregistered, unless a valid registration record was located on at least one other file.
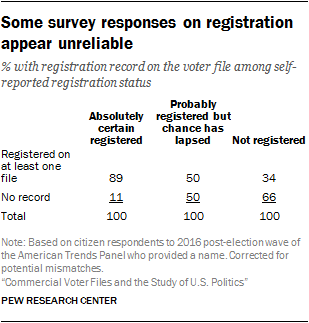
A registration record was located on at least one matched voter file for 89% of panelists who expressed certainty that they are registered. Half (50%) of those who were uncertain about their status (and who are considered unregistered in our normal survey protocol) had a registration record on at least one file. Even 34% of those who said that they are not registered had a registration record on at least one of the files.
Because some official registration records themselves may be out of date, the survey measure may not be as problematic as it appears here. For example, someone who has moved may have a valid registration record at a previous address – perhaps the source of the voter file match – but be unsure as to whether they are registered at their current address. But it is clear that registration status is a murkier concept to capture in a survey.
Modeled partisanship is correct for a majority of cases
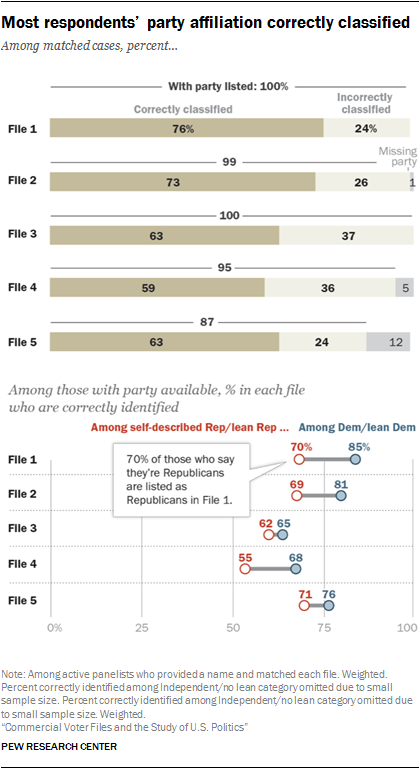
There are traditionally two types of partisanship classifications available in voter files. The first is party registration. However, since this is not available in all states, voter file vendors attempt to model partisanship based on demographics, voter turnout and other factors. While each of these models is different, four vendors provided a modeled score that ranges from 0 to 100, where 0 is most Republican and 100 is most Democratic. One vendor, however, simply categorized panelists by party.
In all, files that provided a modeled 0 to 100 score did a better job of correctly classifying the partisan affiliation of panelists against their self-reported partisanship. In particular, Files 1 and 2 performed relatively well at correctly classifying voters (76% and 73% correctly classified respectively). File 4 had the lowest share of panelists correctly classified (59%), due in part to a higher than average share classified as independent in this model. Two-in-ten American Trends Panel members (20%) matched to File 4 are classified as politically independent, compared with just 3% who self-identify as not leaning towards either party.
In general, all of the files were able to identify Democrats at a higher rate than Republicans. But three vendors stood out in this regard. File 1 correctly identified 85% of Democrats and 70% of Republicans, while File 2 correctly identified 81% of Democrats and 69% of Republicans. And while File 4 had lower rates of accurate identification overall, it, too, was better able to identify Democrats (68% correctly identified) than Republicans (55% correct). The fact that a large majority of blacks identify as or lean Democratic contributes to the higher accuracy rate for Democrats than Republicans.
Modeled turnout scores improve the accuracy of election estimates
Predicted voter turnout is one of the most commonly available and widely used modeled measures. Vendors attempt to model each person’s likelihood of voting in a given election – be it primary, midterm or presidential. Pollsters use this information in building likely voter models, and campaigns use it to allocate resources for mobilization or persuasion. While turnout models are based on voter turnout in previous elections, some also include demographic information and partisanship in the model in an attempt to more accurately predict likely voting behavior.
Modeled turnout scores are typically treated as probabilities and are offered on a 0 to 100 scale, with 0 being the least likely to turn out to vote in a given election and 100 being the most likely to vote. (File 3 did not provide a turnout probability.) Each vendor has its own “secret sauce” that goes into their model. As a result, while all of the models follow a similar 0 to 100 scale, each scale has a different mean and distribution.
To assess the accuracy of the turnout predictions for the 2016 general election, panelists matched by each vendor were sorted by their predicted likelihood of voting into four groups of equal size, referred to here as quartiles. Within each quartile, the average turnout score – the mean of the predicted probabilities for that group – can be compared with the percentage of the group that actually voted. If the predictions are perfectly accurate, the mean of the predicted probabilities and the percentage who voted will be about the same.
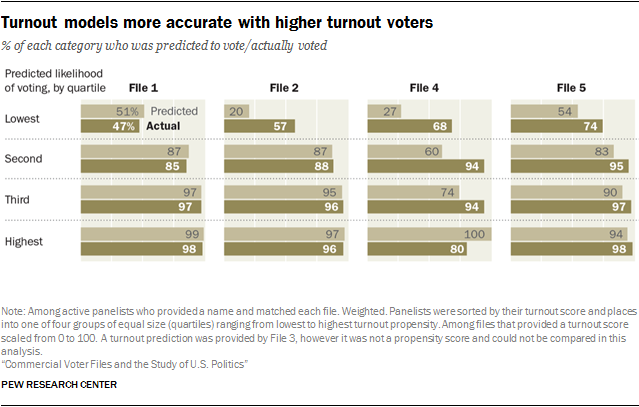
The vendors varied somewhat in the accuracy of their turnout predictions. For three of the four, predictions about turnout among the quarter of the sample rated least likely to vote tended to underestimate the true turnout rate. For example, the average predicted probability of turning out for the lowest quartile in File 4 was just 27%, but among this group 68% actually voted. Two other files (File 2 and File 5) also underestimated actual turnout in the lowest quartile. By contrast, the average predicted turnout for the lowest quartile in File 1 was 51%, and the actual turnout was nearly the same, at 47%.11
Most of the vendors did better with their predictions among voters judged as highly likely to vote, though one of them (File 4) substantially overestimated the share in the highest quartile who would vote.
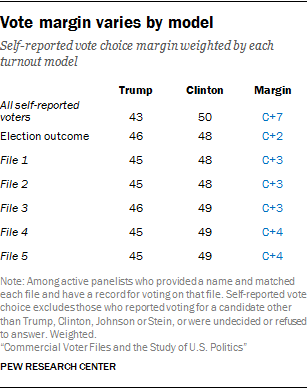
Since these scores can be used to predict who will turn out to vote, they can also be judged by how well they modeled the outcome of the election among those who did vote. Using a technique similar to that employed by pollsters to create a “likely electorate” among respondents to a pre-election survey, panelists who responded to a post-election survey were weighted by their pre-election likelihood of turning out to vote in 2016 (along with the usual survey weighting on demographic and related characteristics).
While self-reported voters in the panel as a group gave Clinton a 7-point advantage (50% for Clinton vs. 43% for Trump), weighting the results by the expected turnout scores from each file produced a result closer to the actual election outcome, which was a 2-point Clinton advantage in the national vote. All the files came close to the actual vote, showing either a 3- or a 4-point Clinton advantage.


