
Note on survey dates
The primary adult data in this report come from a Pew Internet Project survey conducted from April 29 to May 30, 2010. The most current teen data reported here is from a separate Pew Internet survey of teens and their parents conducted from June 26 to September 24, 2009. Data points for some activities, however, come from earlier surveys, as shown by the following table.
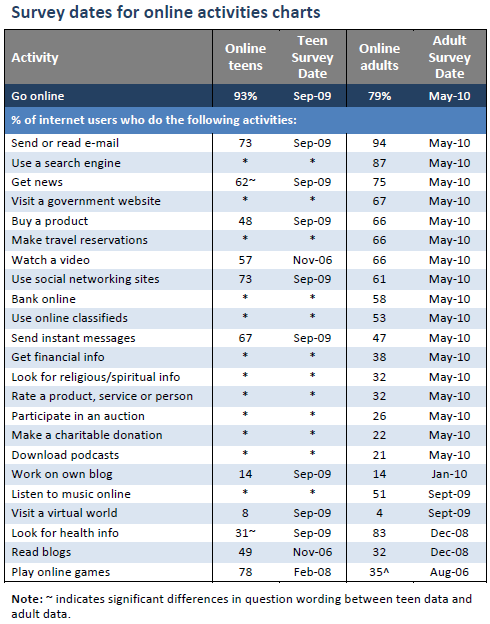
Differences in question wording
Surveys of teens ages 12-17 and adults age 18 and older are conducted in separate surveys, as outlined in the following sections. In general, activities listed for both teens and adults have only minor differences between the question wording between the different surveys. However, for the following questions, differences in question wording may make it more difficult to directly compare the results:
- Getting news online: For adults, this question was “Do you ever use the internet to get news online?” (January 2010). For teens, this question was “Do you ever go online to get news or information about current events or politics?” (September 2009).
- Looking for health information: For adults, this number indicates the percentage of internet users who said they had looked online for information about one of the health topics we asked about, ranging from information about a specific disease, a certain treatment, alternative medicine, health insurance, doctors, hospitals, and ways to stay healthy (December 2008). More information is available in our 2009 report, “The Social Life of Health Information.” For teens, the question was, “Do you ever look online for health, dieting, or physical fitness information?” (September 2009).
For more information about all of the questions on both teen and adult surveys, as well as other details about wording and methodology, please see the individual toplines for each survey. The relevant portions of these surveys may be downloaded as a PDF here, or in the “Explore survey questions” section (“Download”) on the report overview page.
Teens data
The most current teens data in this study is based on the 2009 Parent-Teen Cell Phone Survey which obtained telephone interviews with a nationally representative sample of 800 teens age 12-to-17 years-old and their parents living in the continental United States and on 9 focus groups conducted in 4 U.S. cities in June and October 2009 with teens between the ages of 12 and 18. The survey was conducted by Princeton Survey Research Associates International. The interviews were done in English by Princeton Data Source, LLC from June 26 to September 24, 2009. Statistical results are weighted to correct known demographic discrepancies. For more information about the sample of 12-17-year-olds, please see the Methodology section of the “Teens and Mobile Phones” report (2010). The full data set is available at https://www.pewresearch.org/internet/Shared-Content/Data-Sets/2009/September-2009-Teens-and-Mobile.aspx.
The Parent and Teen Survey on Gaming and Civic Engagement was conducted from November 1, 2007, to February 5, 2008. The margin of sampling error for results based on teen internet users is ±3%. The full data set is available at https://www.pewresearch.org/internet/Shared-Content/Data-Sets/2008/February-2008–Teen-Gaming-and-Civic-Engagement.aspx.
The Parent & Teen Survey on Writing was conducted from September 19 to November 16, 2007. The margin of sampling error for results based on teen internet users is ±5%. The full data set is available at https://www.pewresearch.org/internet/Shared-Content/Data-Sets/2007/November-2007–Teens-and-Writing.aspx.
The Parents & Teens 2006 Survey was conducted from October 23 to November 19, 2006. The margin of sampling error for results based on teen internet users is ±4%. The full data set is available at https://www.pewresearch.org/internet/Shared-Content/Data-Sets/2006/November-2006–Parents-and-Teens.aspx
The Parents & Teens 2004 was conducted from October 26 to November 28, 2004. The margin of sampling error for results based on teen internet users is ±4%. The full data set is available at https://www.pewresearch.org/internet/Shared-Content/Data-Sets/2004/Teens–Parents-2004.aspx.
These and other data sets are also available on our data sets page.
Adults data: May 2010
This report is based on the findings of a daily tracking survey on Americans’ use of the Internet. The results in this report are based on data from telephone interviews conducted by Princeton Survey Research Associates International between April 29 and May 30, 2010, among a sample of 2,252 adults, age 18 and older. Interviews were conducted in English. For results based on the total sample, one can say with 95% confidence that the error attributable to sampling and other random effects is plus or minus 2.4 percentage points. For results based Internet users (n=1,756), the margin of sampling error is plus or minus 2.7 percentage points. In addition to sampling error, question wording and practical difficulties in conducting telephone surveys may introduce some error or bias into the findings of opinion polls.
The margin of error for each generational subgroup, however, can be considerably higher than that for the sample of all internet users. Below is a list of the average margins of error for each age group:
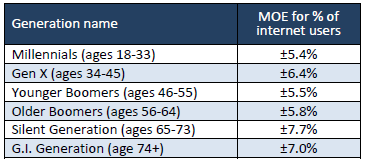
A combination of landline and cellular random digit dial (RDD) samples was used to represent all adults in the continental United States who have access to either a landline or cellular telephone. Both samples were provided by Survey Sampling International, LLC (SSI) according to PSRAI specifications. Numbers for the landline sample were selected with probabilities in proportion to their share of listed telephone households from active blocks (area code + exchange + two-digit block number) that contained three or more residential directory listings. The cellular sample was not list-assisted, but was drawn through a systematic sampling from dedicated wireless 100-blocks and shared service 100-blocks with no directory-listed landline numbers.
New sample was released daily and was kept in the field for at least five days. The sample was released in replicates, which are representative subsamples of the larger population. This ensures that complete call procedures were followed for the entire sample. At least 7 attempts were made to complete an interview at a sampled telephone number. The calls were staggered over times of day and days of the week to maximize the chances of making contact with a potential respondent. Each number received at least one daytime call in an attempt to find someone available. For the landline sample, half of the time interviewers first asked to speak with the youngest adult male currently at home. If no male was at home at the time of the call, interviewers asked to speak with the youngest adult female. For the other half of the contacts interviewers first asked to speak with the youngest adult female currently at home. If no female was available, interviewers asked to speak with the youngest adult male at home. For the cellular sample, interviews were conducted with the person who answered the phone. Interviewers verified that the person was an adult and in a safe place before administering the survey. Cellular sample respondents were offered a post-paid cash incentive for their participation. All interviews completed on any given day were considered to be the final sample for that day.
Non-response in telephone interviews produces some known biases in survey-derived estimates because participation tends to vary for different subgroups of the population, and these subgroups are likely to vary also on questions of substantive interest. In order to compensate for these known biases, the sample data are weighted in analysis. The demographic weighting parameters are derived from a special analysis of the most recently available Census Bureau’s March 2009 Annual Social and Economic Supplement. This analysis produces population parameters for the demographic characteristics of adults age 18 or older. These parameters are then compared with the sample characteristics to construct sample weights. The weights are derived using an iterative technique that simultaneously balances the distribution of all weighting parameters.
Following is the full disposition of all sampled telephone numbers:
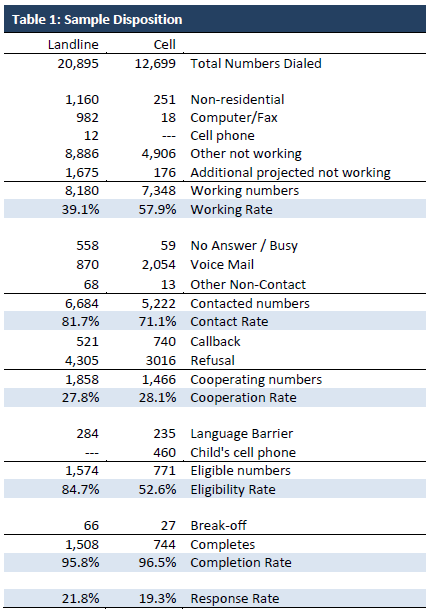
The disposition reports all of the sampled telephone numbers ever dialed from the original telephone number samples. The response rate estimates the fraction of all eligible respondents in the sample that were ultimately interviewed. At PSRAI it is calculated by taking the product of three component rates:
- Contact rate – the proportion of working numbers where a request for interview was made
- Cooperation rate – the proportion of contacted numbers where a consent for interview was at least initially obtained, versus those refused
- Completion rate – the proportion of initially cooperating and eligible interviews that were completed
Thus the response rate for the landline sample was 21.8 percent. The response rate for the cellular sample was 19.3 percent.
The full data set is available at https://www.pewresearch.org/internet/Shared-Content/Data-Sets/2010/May-2010–Cell-Phones.aspx.
This and other data sets are also available on our data sets page.


