Editorial note to readers (March 19, 2025):
This project estimated the number of unauthorized immigrants living in 32 European countries during the mid- to late-2010s. We used what were then the best available data sources from different governments and from the European Union. After our report was published in November 2019, researchers at the University of Oxford’s Migration Observatory identified a problem with the official data from the United Kingdom’s Office for National Statistics (ONS) on the number of legal immigrants residing in the UK.
The ONS data on legal immigrants that we used in our report did not include those with “indefinite leave to remain” (ILR), a group legally residing in the country. Including the ILR group among legal UK residents results in lower estimated total numbers of unauthorized immigrants for both the United Kingdom and Europe in 2017 and other years. The updated estimates for the number of unauthorized immigrants in 2017 (without waiting asylum seekers) are 700,000-900,000 for the UK and 2.8 million-3.5 million for Europe. Updated estimates can be found in this table but are not reflected elsewhere in this report.
Estimates presented in this report for Europe’s unauthorized immigrant population are for the size of this population residing in the European Union (all 28 countries, including the United Kingdom) and European Free Trade Association countries (Iceland, Liechtenstein, Norway and Switzerland), a total of 32 European nations. Estimates are presented for the end of each year, or Dec. 31, in 2014, 2015, 2016 and 2017. Most of the estimates are based on data from Eurostat, Europe’s statistical agency.
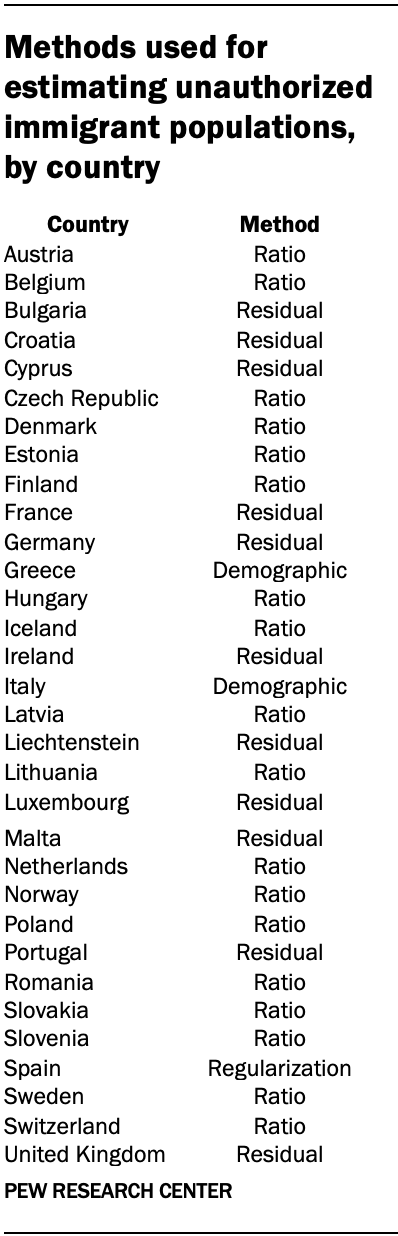
Estimates of the unauthorized immigrant population for EU-EFTA countries are based on four different methodologies:
- Residual method, considered the best methodology for estimating unauthorized immigrant populations. This method was used in 11 of the 32 European countries, which together accounted for more than half (about 60%) of the estimated unauthorized immigrant population in Europe in 2017.
- Demographic components method, a second-best methodology for estimating the unauthorized immigrant population, which was used when the residual method was not possible. This technique was used in Italy and Greece, which together accounted for about 17% of the unauthorized immigrant population in Europe in 2017.
- Regularization method, based on government data indicating the number unauthorized immigrants achieving authorization. This methodology was used for the unauthorized immigrant population estimate in Spain, which accounted for about 3% of the unauthorized immigrant population in Europe in 2017.
- Proportional ratio method, used in countries where the three preferred methods were not possible to implement due to data limitations. This method was used for the majority of countries in the EU-EFTA, 18 of the 32, which together accounted for about one-fifth (20%) of the total unauthorized immigrant population in Europe in 2017.
Many of these same methods were used in the 2008 Clandestino project, the last time a comprehensive estimate of the size of the unauthorized immigrant population in Europe was published. Each of these methods are presented in detail and specifics are further described for the four largest countries – Germany, the UK, Italy and France.
For every country, we provide a range for the estimated number of unauthorized immigrants to reflect the inherent uncertainty in attempting to measure a hidden population. Our analysis focuses on the low and high ends of the range. In some countries, the range reflects different adjustments (for example, adjustments for undercounts in surveys). In other countries, the range reflects alternative methods for estimating the unauthorized immigrant population.
Unauthorized immigrants include those who enter a country without authorization, usually by crossing a border without encountering immigration officials (i.e., clandestine entrants) and continue to not have authorized status. A second group are those who enter with documents permitting residence or temporary stay but stay beyond the expiration of the permit (i.e., visa overstayer).6
A third group of non-EU-EFTA citizens who take up residence in a country without permission to immigrate are people seeking asylum after entry. Although some researchers have excluded asylum seekers from their unauthorized immigrant estimates, most asylum seekers entered their country of residence without authorization and are in an uncertain status as they wait for their application to be processed. Due to their uncertain future in the country, they are included as unauthorized immigrants in this report.
Methods used to estimate the number of unauthorized immigrants in Europe
Residual method
The residual method is based on this simple formula:
Unauthorized immigrants = Total foreign, noncitizens – Authorized noncitizens
(U) = (F) – (A)
EU and EFTA countries annually report to Eurostat estimates of the number of non-EU-EFTA citizens, or foreign citizens, (F) living in their countries. Some of these estimates stem from demographic estimates based on 2011 censuses. Data from large-scale surveys and migrant flows are used to update population estimates that countries send to Eurostat.7
European countries with noncitizen population estimates that are based on censuses and surveys presumably include unauthorized immigrants in their totals, since these surveys cover the entire resident population. European countries where we used the residual method are Bulgaria, Croatia, Cyprus, France, Germany, Ireland, Liechtenstein, Luxembourg, Malta, Portugal and the UK. These countries together account for about 60% of the estimated total number of unauthorized immigrants in Europe.
These same European countries annually report to Eurostat the total number of people which are authorized (A) to live in the country with a residence permit.8 These data contain information on nationality, length of permitted stay (less than 12 months or 12 months and longer) and type of permit (education, family, occupation, refugee or other).9 To remain consistent with population data, which defines residents as those living or intending to live in the country for 12 months or longer, only permits of 12 months or longer are used for our unauthorized immigrant estimates.10
One exception to this general rule is the UK, where permit figures are calculated differently than in other European countries. (See UK Methodology for more details.)
Population estimates for Europe’s non-EU-EFTA-citizen population in many countries include the asylum seeker population waiting for their case to be decided.11 For Bulgaria, Croatia, Liechtenstein and Malta, asylum seekers are not included in the noncitizen population estimate. They were added to our estimates of unauthorized immigrants.
It is widely known that noncitizen populations are regularly under sampled in surveys and censuses.12 Consequently, the high estimates represent a 10% adjustment to account for under-coverage in the underlying survey and census data.13
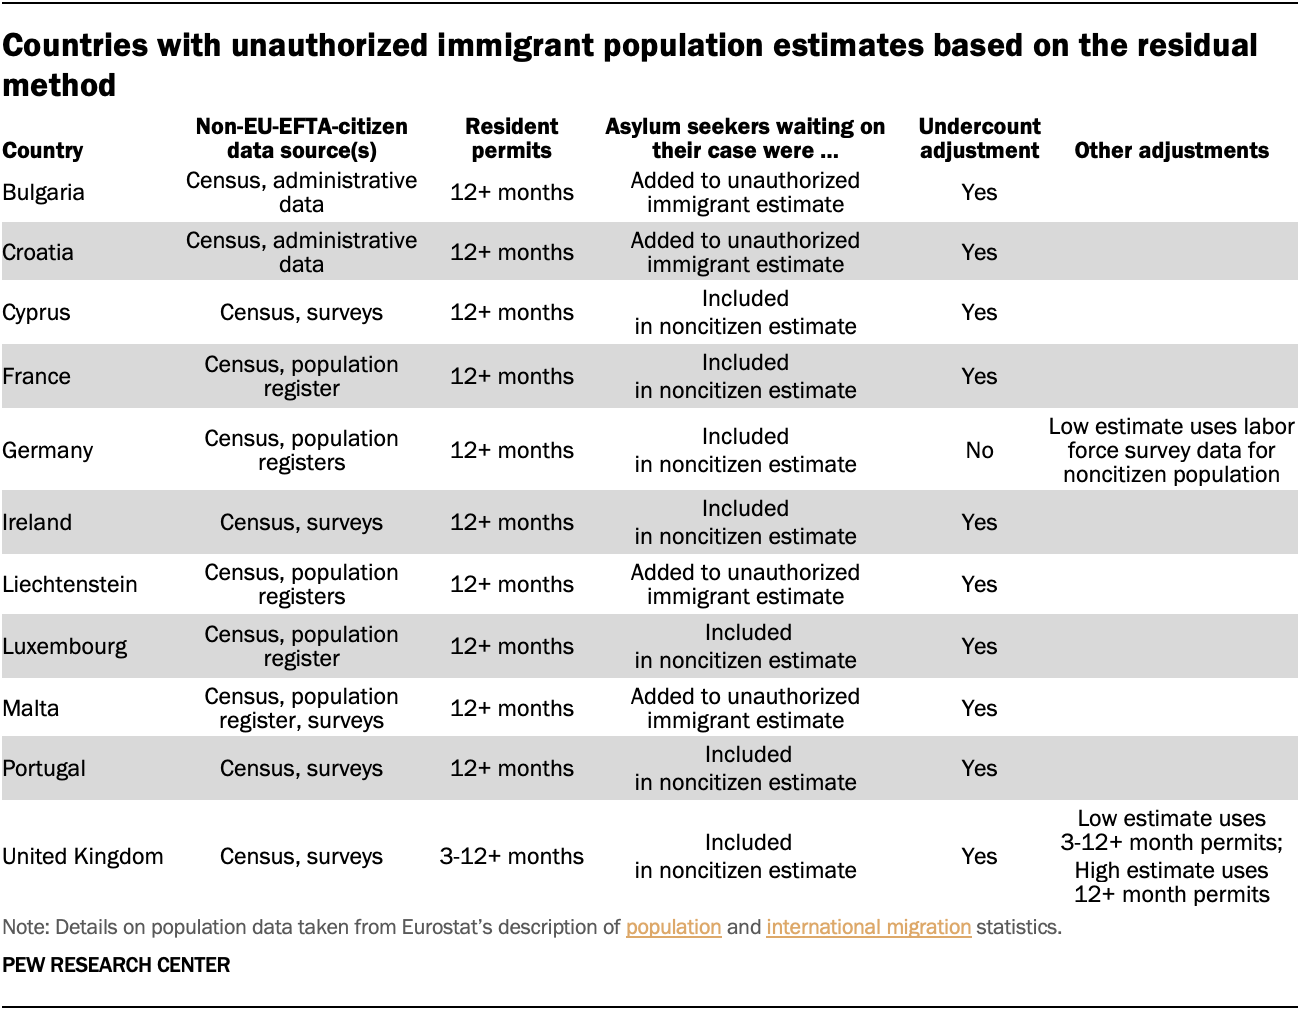
The adjustment is the addition of 10% of the low estimate of unauthorized immigrants without asylum seekers. One exception to this adjustment factor was Germany, which has a very high response rate for its large-scale surveys. Instead, the low estimate used the non-EU-EFTA-citizen share found in Germany’s large-scale labor force survey in 2017, while the high estimate used the noncitizen population figure reported to Eurostat.
Demographic components method
Some European countries such as Italy and Greece have experienced a rapid inflow of migrants over an extended period. Census-based estimates and population registers are often less suitable for estimating unauthorized immigrant populations because the rapid nature of population change due to migration may not be included in these national statistics.
Consequently, an alternative method must be employed to estimate the size of the unauthorized immigrant population. One such method is to start with a previous reliable estimate of the unauthorized immigrant population and apply demographic techniques (in-migration, out-migration, deportations, regularizations, deaths and births) to project forward the unauthorized immigrant population to the years estimated in this report.
In Italy, for example, our estimates start with 2008 estimates from the Clandestino project that used large-scale surveys in the 2000s to measure the unauthorized immigrant population. Then we carried the 2008 estimate forward to 2014 through 2017 with standard demographic techniques based on data for fertility, mortality and migration, all drawn from Eurostat’s aggregate data. Additionally, the number of asylum seekers submitting a first-time application between 2008 and 2017 were added to these totals, adjusting for asylum rejections, withdrawn cases and deportations of unauthorized immigrants.14 Finally, a conservative estimate of visa overstayers based on first-time visas granted between 2008 and 2017 was added to the total. Our range of estimates uses the Clandestino low and high estimates for 2008 as different starting populations.
A similar demographic components method was applied to data from Greece in estimating its unauthorized immigrant population. The 2008 base estimates (low and high) were drawn from the Clandestino project, an estimate originally based on the residual method.
Regularization method
Spain’s data for the noncitizen population is based on the nation’s population register, a listing that may not include unauthorized immigrants and so is not suitable for use in a residual estimate.15 However, unauthorized immigrants in Spain can regularize (apply for temporary residency) after living in the country for two or three years. Data on this regularization of unauthorized status provides a series of data points for a minimum number of unauthorized immigrants that lived in the country before their regularization.
By adding regularizations over a three-year period, an estimate for the earliest year can be produced. For example, by adding years 2014 to 2016, a figure for 2014 can be estimated. For regularizations beyond 2017, regularization trends over a four-year period were extrapolated.16 Because of this method, the estimate for Spain is considered a lower-bound estimate as it is expected some unauthorized immigrants either do not qualify for the regularization program or choose to not take part in it. Finally, asylum seekers waiting on decisions, a population that has grown in recent years in Spain, were added.
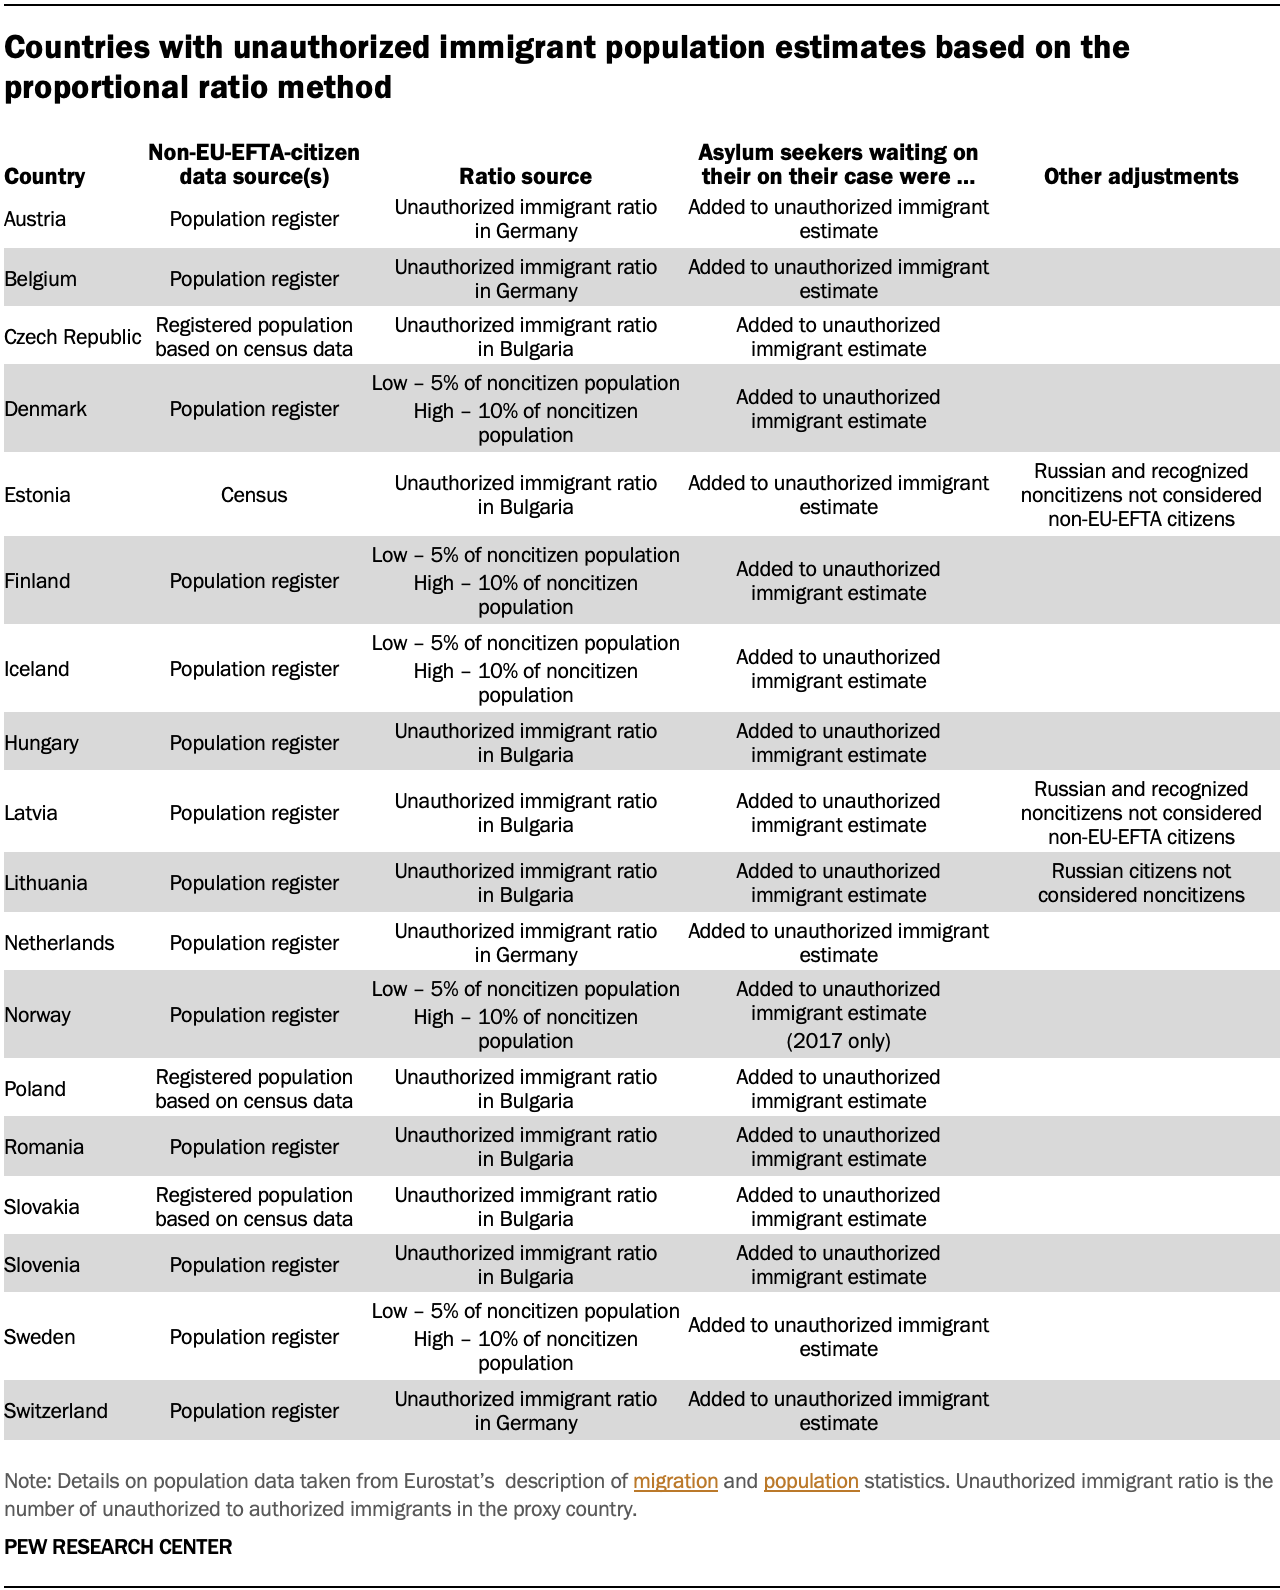
Proportional ratio method
The residual method cannot be applied to countries that estimate the size of their total populations with a population register each year. Population registers rarely include unauthorized immigrants; consequently, a different method is required. The proportional ratio method is based on a ratio of unauthorized immigrants to authorized non-EU-EFTA citizens from countries with similar migration patterns. A ratio method was used by the Clandestino project in 2008 for many countries with smaller immigrant populations.17
These ratios, excluding asylum seekers, were applied to countries with similar immigration histories and immigration policies as proxy countries. The ratio of unauthorized to authorized immigrants in Germany, for example, was applied to the total number of non-EU-EFTA citizens in Austria, Belgium, the Netherlands and Switzerland. Then, asylum seekers in each country waiting for a decision were added to each country’s estimates.
Similarly, Bulgaria serves as a proxy country for many Central/Eastern European countries because it is the only one in the region that uses a census-based estimate for its population and one of the few with a population register that has a financial incentive for residents to de-register upon leaving the country, an important consideration in estimating the non-EU-EFTA population in the country.18 Thus, it is the only country in the region where the residual method can be used to estimate the relatively small unauthorized immigrant population.
Bulgaria is used as a proxy in the proportional ratio method for the Czech Republic, Hungary, Poland, Romania, Slovakia and Slovenia. Bulgaria also serves as a proxy in estimating the unauthorized immigrant populations for Estonia, Latvia and Lithuania, but these countries require special adjustments because of the presence of Russians and other citizens of the former Soviet Union.19 Asylum seekers waiting for a decision on their cases for most countries in this group were added to the final estimates since they are not part of the noncitizen population cited in Eurostat data.
Finally, in Nordic countries (Denmark, Finland, Iceland, Norway and Sweden), a base ratio of 5% for the lower bound estimate and 10% for the higher bound estimate was multiplied by the non-EU-EFTA citizen population in each country. Asylum seekers waiting on final decisions were then added to these numbers.
These ratio levels for Nordic countries were based on research about the number of unauthorized immigrants in the Nordic region. A recent study in Finland, for example, estimated the number of unauthorized immigrants in that country to be below 5,000 in 2017, or less than 5% of the total non-EU-EFTA population.20 Meanwhile, a study in Norway found 12,000 unauthorized immigrants working in Norway in 2015, or about 7% of its non-EU-EFTA population.21 Similarly, in 2016, the Swedish migration agency estimated approximately 50,000 unauthorized immigrants working in various industries including hospitality, transportation, construction and food services.22 This amounted to about 10% of the total non-EU-EFTA citizens. Based on these and other research reports, it is assumed that unauthorized populations not seeking asylum are relatively small in Nordic countries, as many aspects of life (employment, medical care, use of financial institutions) might require country citizenship or a residence permit.
Rounding, ranges and total estimates
The size of the noncitizen population in some European countries can be small, especially when subdivided by country of nationality. And with few border controls between most of the European countries contained in this analysis, people – even those with permits in a particular country – are relatively free to move and reside in other European countries. Consequently, the report places unauthorized immigrant population totals within the larger EU-EFTA population context.
For these reasons, estimates for unauthorized immigrant populations are rounded to the nearest 100,000 to avoid the appearance of unwarranted precision in the estimates.23
The range for Europe’s estimated unauthorized immigrant population is not based on a survey’s margin of error. Instead, the range of estimates reflects different methodological approaches and adjustments to estimates.
Lower bounds of ranges are rounded to the lower 100,000 level unless the unrounded value is within 25,000 of the higher 100,000 level. For example, if the lower-bound value before rounding is between 100,000 and 175,000, it is rounded to 100,000. However, if the unrounded lower bound is 175,000 or higher but less than 200,000 it is rounded to 200,000.
Higher bounds of ranges are rounded to the higher 100,000 level unless the unrounded value is within 25,000 of the lower 100,000 level. For example, if the higher-bound value before rounding is 125,000 or more but less than 200,000, it is rounded to 200,000. But, if the higher-bound value before rounding is between 100,000 and 125,000, it is rounded to 100,000.24
Midpoint estimates between low and high estimates are used to compute shares for the total number of noncitizens living in EU-EFTA countries and the share of unauthorized immigrants of countries’ total populations. Because each figure is rounded separately, rounded estimates may not add to rounded totals. Similarly, shares in this report are computed using unrounded numbers.
The total number of non-EU-EFTA citizens living in Europe is based on data from Eurostat plus additional unauthorized immigrants estimated by the Center that are likely not included in Eurostat data on citizenship.
Detailed methods for countries with the largest unauthorized immigrant population estimates
Methodology for Germany
Pew Research Center used the residual method to estimate the size of the unauthorized immigrant population in Germany. Estimates for the total non-EU-EFTA-citizen population for Germany were drawn from Eurostat’s figures for non-EU-EFTA citizens. This is the usual resident population (12 months or longer) based on census, population register and migration flow data. As this non-EU-EFTA-citizen population estimate from Eurostat is partially based on register and earlier German census data that may be out of date, another estimate of this base population was derived from Germany’s labor force survey, a compulsory, annual survey based on addresses in the population register and updates of other addresses in Germany, regardless of legal status of residents.
For the residual high estimate, the number of non-EU-EFTA citizens with 12-month or longer residency permits, as reported by Germany to Eurostat, was deducted from the total non-EU-EFTA-citizen population figure based on the census and population register reported to Eurostat. A separate, low estimate used the same residency permits figure from Germany but subtracted it from the non-EU-EFTA citizen population as measured by Germany’s labor force survey. Unlike many other European countries, an undercount adjustment was not added to the survey total since Germany’s labor force survey has a very high response rate, about 96% in 2017. These procedures lead to unauthorized immigrant population estimates between 1.0 million and 1.2 million in 2017.
These estimates include several different categories of unauthorized immigrants – defined in this report as non-EU-EFTA citizens without permanent residency. The groups include: (1) those waiting for an asylum decision (444,000 in 2017); (2) those with officially tolerated statuses (temporary protection from deportation) such as Duldung (about 166,000 in 2017); (3) deportees without toleration (about 63,000 in 2017); (4) those waiting on a residency permit (as many as 200,000 in 2017);25 and (5) a remainder category of other unauthorized immigrants (roughly 100,000 to 300,000 additional people).26
Comparison with previous estimates for Germany
[27.Suspected crimes are those recorded by the police to the public prosecutor or Ausgangsstatistik.]
Given the volume of asylum seekers in 2015 and 2016 who entered Germany and the hundreds of thousands who have seen their asylum applications rejected, our annual estimates for the country are in line with expectations from Vogel’s earlier 2014 estimate and trend. As a further robustness check, the Center replicated Vogel’s method and found that the Center’s 2017 estimate is within the range of the “multiplier” method for that year. The result was about 300,000 to nearly 1.1 million unauthorized immigrants, without asylum seekers or those in a tolerated deportation status. The lower end of this alternative estimation method is similar to the combined number of unauthorized immigrants in the Center’s residual method without waiting asylum seekers or those under deportation orders, roughly some 300,000 to 500,000 people.27
Methodology for the United Kingdom
The Center used the residual method in estimating the size of the unauthorized immigrant population in the UK. Estimates for the total non-EU-EFTA-citizen population were drawn from those submitted by the UK to Eurostat. These figures are estimated based on census and survey data.28 Then, the number of noncitizens with residency permits reported by the UK to Eurostat were deducted from noncitizen population estimates from Eurostat. Since these permit data are calculated differently in the UK than in other European countries, a range of estimates based on the duration of the permits were produced. The low estimates use permits of three months or longer. The high estimates use permits of 12 months or longer, the approach used for most other European countries. High estimates were adjusted for undercount in the census-based total population figures following the approach used by the UK Home Office for the 2001 estimate of the unauthorized immigrant population. An undercount adjustment of 10% was added to the preliminary low unauthorized immigrant population estimate without asylum seekers with pending cases.29 Then, the number of noncitizens with residency permits reported by the UK to Eurostat were deducted from noncitizen population estimates from Eurostat. Since these permit data are calculated differently in the UK than in other European countries, a range of estimates based on the duration of the permits were produced. The low estimates use permits of three months or longer. The high estimates use permits of 12 months or longer, the approach used for most other European countries. High estimates were adjusted for undercount in the census-based total population figures following the approach used by the UK Home Office for the 2001 estimate of the unauthorized immigrant population. An undercount adjustment of 10% was added to the preliminary low unauthorized immigrant population estimate without asylum seekers with pending cases.29
Comparison with previous UK estimates
The UK Home Office estimated that between 310,000 and 570,000 unauthorized immigrants lived in the UK in 2001 using the residual method, with a further 175,000 temporary or quasi-legal immigrants, mostly people waiting on their asylum claims.31 Several years later, a separate London School of Economics study updated the Home Office estimates to be between 417,000 to 863,000 in 2007.32 Ten years later, after hundreds of thousands additional migrants from non-EU-EFTA countries have entered and stayed in the UK, our 2017 estimate of 800,000 to 1.2 million unauthorized immigrants is in line with migration trends.
Meanwhile, Georges Lemaître, an economist formerly with the Organization for Economic Cooperation and Development, estimated the number of unauthorized immigrants living in the UK to have been between 617,000 and 861,000 in 2011. Alasdair Palmer and David Wood, former Home Office staff, stated that it was well above 1.2 million in 2017, but no methodology was provided for their estimate.
Methodology for Italy
We used a demographic components method for estimating the size of Italy’s unauthorized immigrant population. Our estimate for Italy starts with the range of 2008 estimates from the Clandestino project, which are based on large-scale surveys in the 2000s of immigrants in the country. Then, this starting point is adjusted for subsequent years by demographic components (fertility, mortality, migration) drawn from Eurostat’s aggregate data for Italy. A quasi-general fertility rate for non-EU-EFTA-citizen women ages 15 to 64 in Italy was applied to the high estimate. The fertility rate was then divided by half to take into account disrupted fertility experienced by migrants as well as the possibility of a child’s father authorized to be in the country, potentially leading to a child who can also live in Italy with authorization. The mortality rate was calculated from annual deaths of non-EU-EFTA nationals and applied to both low and high estimates. Demographic and migration components were distributed by sex and age (<15, 15-64, 65+).
Italy experienced significant economic recessions in 2008-2009 and 2012-2013, impacting the nation’s residents, including authorized and unauthorized immigrants living there. This event, combined with large-scale movement of migrants by sea over the same period, have made estimating the size of the total non-EU-EFTA population living in Italy difficult. Also, the Italian government’s own estimates of its non-EU-EFTA population are based on population registers, which likely do not include many unauthorized immigrants.
The number of asylum seekers in Italy between 2008 and 2017 were added to these totals, adjusting for asylum rejections, withdrawn cases and removals of unauthorized immigrants as reported by the Italian government to Eurostat. Finally, an estimate of visa overstayers based on first-time visas issued between 2008 and 2017 was added to the total. In all, between 500,000 and 700,000 unauthorized immigrants were estimated to have lived in Italy at the end of 2017.
Italy has detected hundreds of thousands of migrants entering the country without authorization during the past decade. Some have applied for asylum in Italy, as per the Dublin agreement. The agreement states that the first EU country the asylum seeker enters is responsible for reviewing the asylum seeker’s application for asylum. Among these asylum applicants, some have been given refugee status and can stay in Italy with authorization. Others have moved on to other EU countries. And still others have had their application for asylum rejected, yet they remain in Italy without authorization. These inflows and outflows of unauthorized migrants must be added to the number of unauthorized migrants who were already living in Italy before the growing number of asylum seekers began a decade ago.
Comparison with previous Italy estimates
Our annual estimates are slightly higher than those reported by Gian Carlo Blangiardo in Fondazione ISMU’s report on migration in Italy as well as more recent estimates of Italy’s unauthorized immigrant population. The major difference between our estimate and ISMU’s estimates are births of unauthorized immigrant children added to annual totals. In this report, children born to unauthorized immigrant parents are also part of the unauthorized immigrant population, even though certain protections are awarded to unaccompanied migrant children. The 2017 high estimate would be about 600,000 unauthorized immigrants when children, regardless of being unaccompanied or having family, are not included, or about 100,000 lower than the high estimate shown in this report.
Methodology for France
We used the residual method in estimating the unauthorized immigrant population in France. Estimates for the total non-EU-EFTA citizen population in France were taken from Eurostat. These estimates are census-based for the resident population (12 months or longer), including those living in overseas territories and according to INSEE (Institut National de la Statistique et des Etudes Economiques) include all immigrants, regardless of legal status. The number of authorized immigrants is drawn from resident permit data also provided by Eurostat, of which permits of 12 months or longer were used. These permit data also include those living in overseas territories.
As with many other European countries, survey undercount adjustments of 10% of the unauthorized immigrant population, excluding asylum seekers, were added to reach the higher-bound estimates. A range of 300,000 to 400,000 unauthorized immigrants were estimated to live in France in 2017 when including asylum seekers waiting for a decision on their case.
Comparison with previous French estimates
Generating an estimate of the unauthorized immigrant population in France is challenging, but government leaders as well as demographers have estimated it to be in the vicinity of 300,000 and 400,000, partially based on the number of people enrolled on a government medical plan available to unauthorized immigrants. There were an estimated 300,000 unauthorized immigrants on this plan in 2017.
Measuring characteristics of unauthorized immigrants
Data on the demographic characteristics of Europe’s unauthorized immigrant population (e.g., age, sex, origins) are developed with an adaptation of Pew Research Center’s methods for measuring the demographic characteristics of unauthorized immigrants in the U.S. Specifically, the methods involve assigning authorized status probabilistically to noncitizen respondents in large-scale surveys.
The application of these methods depends on the coverage, quality and sample size of the survey in each country as well as the relative size of the estimated unauthorized immigrant population in the country. Accordingly, the figures shown in this report are based on the noncitizen samples in Eurostat’s labor force surveys (LFS) that rely on a census or an address-based sample. Surveys using an address-based sample likely include unauthorized immigrants. By contrast, surveys based exclusively on population registers, used by many European countries as the sampling frame for their labor force surveys, are less likely to include unauthorized immigrants.
Consequently, demographic characteristics presented in this report are based on labor force survey data for 18 countries: Bulgaria, Croatia, Cyprus, the Czech Republic, Estonia, France, Germany, Greece, Hungary, Ireland, the Netherlands, Poland, Portugal, Romania, Slovakia, Spain, Switzerland and the UK. The resulting data on demographic characteristics are combined with data on the demographic characteristics of asylum seekers waiting for a decision in all 32 EU-EFTA countries. These two groups together make up the overwhelming majority of Europe’s unauthorized immigrant population (84%). More detailed demographic profiles of unauthorized immigrant populations are presented for Germany and the UK – the two countries with the largest unauthorized immigrant populations and a sufficiently high number of respondents in their surveys to present a profile of these groups.
The LFS is a household survey conducted throughout the year by each European country. Each country annually sends individual-level data to Eurostat for compilation. These micro-data were obtained by the Center through a research agreement with Eurostat.33
Citizenship questions are asked of LFS respondents, with most countries asking first whether they are a citizen of their current country of residence. These data define the sample of non-EU-EFTA citizens within the labor force surveys that are assigned as either a likely authorized or likely unauthorized foreign citizen.
Those who are highly likely to be authorized residents are assigned status first. All non-EU-EFTA citizens living in their current country of residence for 25 years or longer, for example, are considered to have authorized residence. It is assumed that noncitizens living in Europe for that length of time were authorized to be in the country from the start of their residence or have found some way to obtain authorized status during this period. Additionally, unauthorized immigrants living in Spain for more than five years and Greece for more than 15 years are considered authorized immigrants because these two countries have had relatively recent regularizations of their unauthorized immigrant populations.
Those ages 15 and older (of working age in the survey) who stated they are not working because they are attending school are assumed to also have authorized residence. Those who registered with public employment offices and/or are receiving public employment benefits are also considered to be authorized residents. Individuals in the military are considered authorized residents, as are those working in occupations that would require official licensure (for example, scientists, architects, medical professionals, educators, airline pilots). Government officials and employees are also considered authorized residents.34
Households were analyzed for possible links of authorized residence with other household members. Spouses and children of citizen adults, for example are considered to be authorized in the country. It is also assumed that minor children are authorized to be in the country if they have a parent in the home who is a citizen or has authorized status. These authorized assignments were repeated for multigenerational households as well.
The remaining noncitizens are considered potential unauthorized immigrants in labor force surveys. Assignment of unauthorized immigrant status among potential unauthorized immigrants is based on probabilities drawn from the estimation step of the study for each country of residence. The probability that a noncitizen in the survey is an unauthorized immigrant is the share of the unauthorized immigrant population estimate in the country (without asylum seekers).35
Respondents with a potential unauthorized status are then randomly assigned as authorized or unauthorized according to country of residence probabilities. This process is done in a series of iterations, repeating the household rules for spouses and children described earlier so that unauthorized immigrants across household members are consistent with earlier assignments. This iterative process is closed once the number assigned as unauthorized immigrants agrees with the estimated number of unauthorized immigrants in the country.
Survey weights were applied to nationality, time in country and demographics for identified unauthorized immigrants in each country’s survey. The shares were then applied to the estimated number of unauthorized immigrants in each country without asylum seekers. Counts for asylum seekers waiting for a resolution in their case according to nationality, time in country and demographic breakdowns were added to estimates from the labor force survey.36