
This report aims to gain an understanding of social media influencers who focus on health and wellness topics and the experience of U.S. adults who get such information from these influencers. It uses two different methodologies, including an analysis of health and wellness influencers who regularly post on Instagram, TikTok or YouTube, as well as a nationally representative survey of U.S. adults conducted through Pew Research Center’s American Trends Panel (ATP).
Survey
Survey data in this report comes from two waves of the American Trends Panel (ATP), Pew Research Center’s nationally representative panel of randomly selected U.S. adults. It includes data from ATP Wave 173, conducted June 9-15, 2025, and ATP Wave 182, conducted Oct. 20-26, 2025.
The American Trends Panel survey methodology, Wave 173
Overview
Wave 173 of the American Trends Panel (ATP) was conducted June 9-15, 2025. A total of 5,023 panelists responded out of 5,737 who were sampled, for a survey-level response rate of 88%.
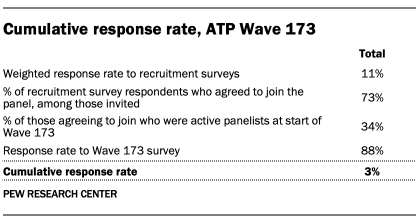
The cumulative response rate accounting for nonresponse to the recruitment surveys and attrition is 3%. The break-off rate among panelists who logged on to the survey and completed at least one item is 1%. The margin of sampling error for the full sample of 5,023 respondents is plus or minus 1.6 percentage points.
The survey includes an oversample of non-Hispanic Asian adults in order to provide more precise estimates of the opinions and experiences of this smaller demographic subgroup. Oversampled groups are weighted back to reflect their correct proportions in the population.
SSRS conducted the survey for Pew Research Center via online (n=4,842) and live telephone (n=181) interviewing. Interviews were conducted in both English and Spanish.
To learn more about the ATP, read “About the American Trends Panel.”
Panel recruitment
Since 2018, the ATP has used address-based sampling (ABS) for recruitment. A study cover letter and a pre-incentive are mailed to a stratified, random sample of households selected from the U.S. Postal Service’s Computerized Delivery Sequence File. This Postal Service file has been estimated to cover 90% to 98% of the population.1 Within each sampled household, the adult with the next birthday is selected to participate. Other details of the ABS recruitment protocol have changed over time but are available upon request.2 Prior to 2018, the ATP was recruited using landline and cellphone random-digit-dial surveys administered in English and Spanish.
A national sample of U.S. adults has been recruited to the ATP approximately once per year since 2014. In some years, the recruitment has included additional efforts (known as an “oversample”) to improve the accuracy of data for underrepresented groups. For example, Hispanic adults, Black adults and Asian adults were oversampled in 2019, 2022 and 2023, respectively.
Sample design
The overall target population for this survey was noninstitutionalized persons ages 18 and older living in the United States. It featured a stratified random sample from the ATP in which non-Hispanic Asian adults were selected with certainty. The remaining panelists were sampled at rates designed to ensure that the share of respondents in each stratum is proportional to its share of the U.S. adult population to the greatest extent possible. Respondent weights are adjusted to account for differential probabilities of selection as described in the Weighting section below.
Questionnaire development and testing
The questionnaire was developed by Pew Research Center in consultation with SSRS. The web program used for online respondents was rigorously tested on both PC and mobile devices by the SSRS project team and Pew Research Center researchers. The SSRS project team also populated test data that was analyzed in SPSS to ensure the logic and randomizations were working as intended before launching the survey.
Incentives
All respondents were offered a post-paid incentive for their participation. Respondents could choose to receive the post-paid incentive in the form of a check or gift code to Amazon.com, Target.com or Walmart.com. Incentive amounts ranged from $5 to $20 depending on whether the respondent belongs to a part of the population that is harder or easier to reach. Differential incentive amounts were designed to increase panel survey participation among groups that traditionally have low survey response propensities.
Data collection protocol
The data collection field period for this survey was June 9 to 15, 2025. Surveys were conducted via self-administered web survey or by live telephone interviewing.
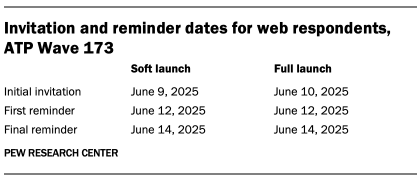
For panelists who take surveys online:3 Postcard notifications were mailed to a subset on June 9.4 Survey invitations were sent out in two separate launches: soft launch and full launch. Sixty panelists were included in the soft launch, which began with an initial invitation sent on June 9. All remaining English- and Spanish-speaking sampled online panelists were included in the full launch and were sent an invitation on June 10.
Panelists participating online were sent an email invitation and up to two email reminders if they did not respond to the survey. ATP panelists who consented to SMS messages were sent an SMS invitation with a link to the survey and up to two SMS reminders.
For panelists who take surveys over the phone with a live interviewer: Prenotification postcards were mailed on June 6. Soft launch took place on June 9 and involved dialing until a total of seven interviews had been completed. All remaining English- and Spanish-speaking sampled phone panelists’ numbers were dialed throughout the remaining field period. Panelists who take surveys via phone can receive up to six calls from trained SSRS interviewers.
Data quality checks
To ensure high-quality data, Center researchers performed data quality checks to identify any respondents showing patterns of satisficing. This includes checking for whether respondents left questions blank at very high rates or always selected the first or last answer presented. As a result of this checking, three ATP respondents were removed from the survey dataset prior to weighting and analysis.
Weighting
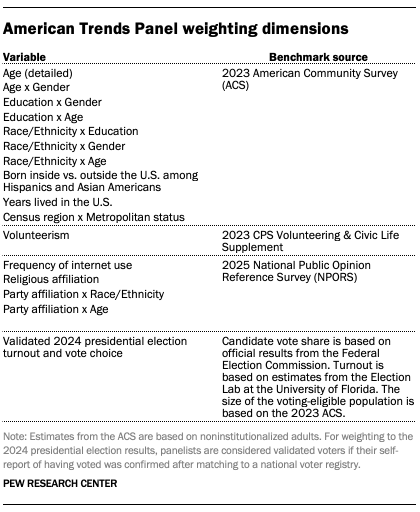
The ATP data is weighted in a process that accounts for multiple stages of sampling and nonresponse that occur at different points in the panel survey process. First, each panelist begins with a base weight that reflects their probability of recruitment into the panel. These weights are then calibrated to align with the population benchmarks in the accompanying table to correct for nonresponse to recruitment surveys and panel attrition. If only a subsample of panelists was invited to participate in the wave, this weight is adjusted to account for any differential probabilities of selection.
Among the panelists who completed the survey, this weight is then calibrated again to align with the population benchmarks identified in the accompanying table and trimmed at the 1st and 99th percentiles to reduce the loss in precision stemming from variance in the weights. Sampling errors and tests of statistical significance take into account the effect of weighting.

The following table shows the unweighted sample sizes and the error attributable to sampling that would be expected at the 95% level of confidence for different groups in the survey.
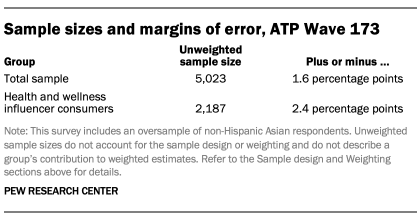
Sample sizes and sampling errors for other subgroups are available upon request. In addition to sampling error, one should bear in mind that question wording and practical difficulties in conducting surveys can introduce error or bias into the findings of opinion polls.
Dispositions and response rates

The American Trends Panel survey methodology, Wave 182
Overview
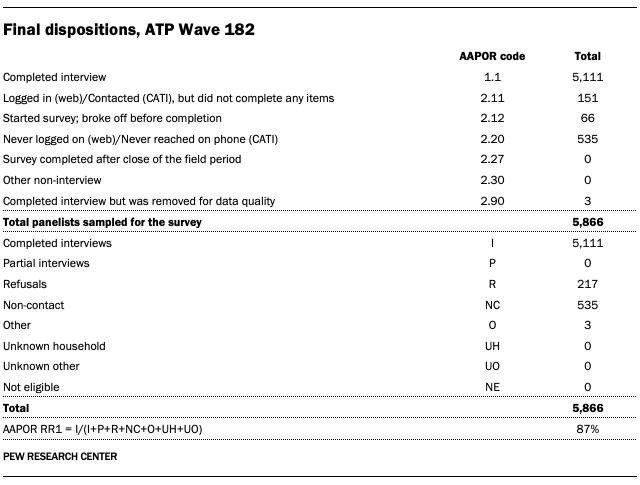
Wave 182 of the American Trends Panel (ATP) was conducted from Oct. 20 to 26, 2025. A total of 5,111 panelists responded out of 5,866 who were sampled, for a survey-level response rate of 87%.
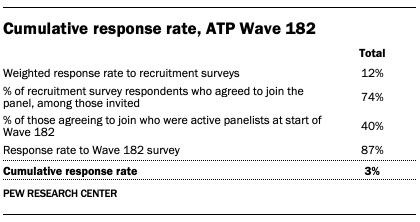
The cumulative response rate accounting for nonresponse to the recruitment surveys and attrition is 3%. The break-off rate among panelists who logged on to the survey and completed at least one item is 1%. The margin of sampling error for the full sample of 5,111 respondents is plus or minus 1.7 percentage points.
The survey includes an oversample of non-Hispanic Asian adults and parents with children younger than 18 in order to provide more precise estimates of the opinions and experiences of these smaller demographic subgroups. These oversampled groups are weighted back to reflect their correct proportions in the population.
SSRS conducted the survey for Pew Research Center via online (n=4,945) and live telephone (n=166) interviewing. Interviews were conducted in both English and Spanish.
To learn more about the ATP, read “About the American Trends Panel.”
Panel recruitment
Since 2018, the ATP has used address-based sampling (ABS) for recruitment. A study cover letter and a pre-incentive are mailed to a stratified, random sample of households selected from the U.S. Postal Service’s Computerized Delivery Sequence File. This Postal Service file has been estimated to cover 90% to 98% of the population.5 Within each sampled household, the adult with the next birthday is selected to participate. Other details of the ABS recruitment protocol have changed over time but are available upon request.6 Prior to 2018, the ATP was recruited using landline and cellphone random-digit-dial surveys administered in English and Spanish.
A national sample of U.S. adults has been recruited to the ATP approximately once per year since 2014. In some years, the recruitment has included additional efforts (known as an “oversample”) to improve the accuracy of data for underrepresented groups. For example, Hispanic adults, Black adults and Asian adults were oversampled in 2019, 2022 and 2023, respectively.
Sample design
The overall target population for this survey was noninstitutionalized persons ages 18 and older living in the United States. It featured a stratified random sample from the ATP in which non-Hispanic Asian adults and parents with children younger than 18 were selected with certainty. The remaining panelists were sampled at rates designed to ensure that the share of respondents in each stratum are proportional to its share of the U.S. adult population to the greatest extent possible. Respondent weights are adjusted to account for differential probabilities of selection as described in the Weighting section below.
Questionnaire development and testing
The questionnaire was developed by Pew Research Center in consultation with SSRS. The web program used for online respondents was rigorously tested on both PC and mobile devices by the SSRS project team and Pew Research Center researchers. The SSRS project team also populated test data that was analyzed in SPSS to ensure the logic and randomizations were working as intended before launching the survey.
Incentives
All respondents were offered a post-paid incentive for their participation. Respondents could choose to receive the post-paid incentive in the form of a check or gift code to Amazon.com, Target.com or Walmart.com. Incentive amounts ranged from $5 to $20 depending on whether the respondent belongs to a part of the population that is harder or easier to reach. Differential incentive amounts were designed to increase panel survey participation among groups that traditionally have low survey response propensities.
Data collection protocol
The data collection field period for this survey was Oct. 20 to 26, 2025. Surveys were conducted via self-administered web survey or by live telephone interviewing.
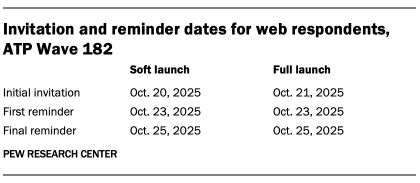
For panelists who take surveys online:7 Postcard notifications were mailed to a subset on Oct. 20.8 Survey invitations were sent out in two separate launches: soft launch and full launch. Sixty panelists were included in the soft launch, which began with an initial invitation sent on Oct. 20. All remaining English- and Spanish-speaking sampled online panelists were included in the full launch and were sent an invitation on Oct. 21.
Panelists participating online were sent an email invitation and up to two email reminders if they did not respond to the survey. ATP panelists who consented to SMS messages were sent an SMS invitation with a link to the survey and up to two SMS reminders.
For panelists who take surveys over the phone with a live interviewer: Prenotification postcards were mailed on Oct. 17. Soft launch took place on Oct. 20 and involved dialing until a total of four interviews had been completed. All remaining English- and Spanish-speaking sampled phone panelists’ numbers were dialed throughout the remaining field period. Panelists who take surveys via phone can receive up to six calls from trained SSRS interviewers.
Data quality checks
To ensure high-quality data, Center researchers performed data quality checks to identify any respondents showing patterns of satisficing. This includes checking for whether respondents left questions blank at very high rates or always selected the first or last answer presented. As a result of this checking, three ATP respondents were removed from the survey dataset prior to weighting and analysis.
Weighting
The ATP data is weighted in a process that accounts for multiple stages of sampling and nonresponse that occur at different points in the panel survey process. First, each panelist begins with a base weight that reflects their probability of recruitment into the panel. These weights are then calibrated to align with the population benchmarks in the accompanying table to correct for nonresponse to recruitment surveys and panel attrition. If only a subsample of panelists was invited to participate in the wave, this weight is adjusted to account for any differential probabilities of selection.
Among the panelists who completed the survey, this weight is then calibrated again to align with the population benchmarks identified in the accompanying table and trimmed at the 1st and 99th percentiles to reduce the loss in precision stemming from variance in the weights. Sampling errors and tests of statistical significance take into account the effect of weighting.
The following table shows the unweighted sample sizes and the error attributable to sampling that would be expected at the 95% level of confidence for different groups in the survey.
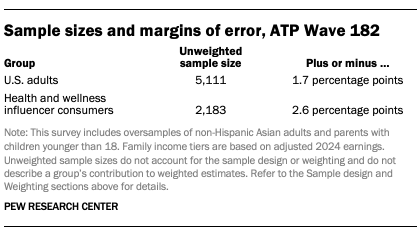
Sample sizes and sampling errors for other subgroups are available upon request. In addition to sampling error, one should bear in mind that question wording and practical difficulties in conducting surveys can introduce error or bias into the findings of opinion polls.
A note about the Asian adult sample
This survey includes a total sample size of 559 Asian adults. The sample primarily includes English-speaking Asian adults and, therefore, may not be representative of the overall Asian adult population. Despite this limitation, it is important to report the views of Asian adults on the topics in this study. As always, Asian adults’ responses are incorporated into the general population figures throughout this report.
How family income tiers are calculated
Family income data reported in this study is adjusted for household size and cost-of-living differences by geography. Panelists then are assigned to income tiers that are based on the median adjusted family income of all American Trends Panel members. The process uses the following steps:
- First, panelists are assigned to the midpoint of the income range they selected in a family income question that was measured on either the most recent annual profile survey or, for newly recruited panelists, their recruitment survey. This provides an approximate income value that can be used in calculations for the adjustment.
- Next, these income values are adjusted for the cost of living in the geographic area where the panelist lives. This is calculated using price indexes published by the U.S. Bureau of Economic Analysis. These indexes, known as Regional Price Parities (RPP), compare the prices of goods and services across all U.S. metropolitan statistical areas as well as non-metro areas with the national average prices for the same goods and services. The most recent available data at the time of the annual profile survey is from 2023. Those who fall outside of metropolitan statistical areas are assigned the overall RPP for their state’s non-metropolitan area.
- Family incomes are further adjusted for the number of people in a household using the methodology from Pew Research Center’s previous work on the American middle class. This is done because a four-person household with an income of say, $50,000, faces a tighter budget constraint than a two-person household with the same income.
- Panelists are then assigned an income tier. “Middle-income” adults are in families with adjusted family incomes that are between two-thirds and double the median adjusted family income for the full ATP at the time of the most recent annual profile survey. The median adjusted family income for the panel is roughly $77,800. Using this median income, the middle-income range is about $51,900 to $155,600. Lower-income families have adjusted incomes less than $51,900 and upper-income families have adjusted incomes greater than $155,600 (all figures expressed in 2024 dollars and scaled to a household size of three). A panelist is assigned “no answer” in the income tier variable if they did not provide all three pieces of information needed to calculate their tier (family income, household size and residential address).
Two examples of how a given area’s cost-of-living adjustment was calculated are as follows: the Pine Bluff metropolitan area in Arkansas is a relatively inexpensive area, with a price level that is 19.7% less than the national average. The San Francisco-Oakland-Berkeley metropolitan area in California is one of the most expensive areas, with a price level that is 18.2% higher than the national average. Income in the sample is adjusted to make up for this difference. As a result, a family with an income of $40,200 in the Pine Bluff area is as well off financially as a family of the same size with an income of $59,100 in San Francisco.
Dispositions and response rates
Analysis of health and wellness influencers
To better understand the health and wellness landscape on social media, researchers conducted an in-depth analysis of influencers who discuss health and wellness topics to large U.S. audiences on Instagram, TikTok or YouTube.
In the social media analysis portion of this report, health and wellness influencers are defined as people (not organizations or brands) who regularly post health and wellness information on Instagram, TikTok or YouTube. To be included in this analysis, they must have at least 100,000 followers on one of those three social media sites, primarily discuss their content in English, and address a U.S. audience. For the purposes of this research, “health and wellness” refers to the information or discussion of treatments or lifestyle practices to improve or maintain physical or mental health or wellness. This may include medical advice, personal health testimonials, commentary and other holistic guidance for how to live a healthy lifestyle.
The final analysis was conducted on a sample of 6,828 health and wellness influencers that were identified through a combination of targeted health and wellness keyword searches and site auditing.
Key terms search
To focus our analysis on only influencers who discuss health and wellness topics, we started by developing a list of search terms that are relevant to wellness trends and current health discussions in the United States. We conducted a topic search for each key term on each of Instagram, TikTok, and YouTube using Modash, a third-party social media marketing data platform.
From June to September 2025, five researchers brainstormed key terms across 14 health and wellness categories. These categories included physical health, mental health, diet and nutrition, beauty, supplements and vitamins, health philosophies, medical practices, women’s health, natural health, fitness, cosmetic treatments and surgeries, dental, sleep, and health devices. The initial list of topic key terms was built based on a review of existing literature on health and wellness influencers, qualitative analysis of topics mentioned by popular health and wellness influencers, and input from research team members with expertise in health and science. The topic key term list was further refined with iterative tests of search results across Instagram, TikTok and YouTube on Modash. Since each site is slightly different, we adjusted some of our search terms to return the largest set of results on each site. We also took note of algorithmically recommended similar searches and considered these for inclusion in our search term list.
For each search, we applied filters to get accounts that are based in the U.S., are operated by people (rather than businesses or organizations), post primarily in English, and have at least 100,000 followers. In total, we conducted the influencer account search with 333 key terms on Instagram, 334 on TikTok and 270 on YouTube from Sept. 19 to Oct. 9, 2025.
These searches resulted in 22,444 Instagram accounts, 21,152 TikTok accounts and 2,552 YouTube accounts (46,148 accounts in total).
Identifying additional influencers from podcasts
In the survey portion of this analysis, we asked U.S. adults about their experiences getting health and wellness information from social media influencers and podcasts. Although this report does not include findings from sites other than Instagram, TikTok, and YouTube, podcasts are an important part of the health and wellness influencer landscape. To ensure that popular podcast hosts were included in our set of influencers, we collected the Spotify health and fitness podcast charts (Top 50) and the Apple Podcasts health and fitness top shows (Top 100) each day from Aug. 12 to Sept. 14, 2025. Then, members of the research team manually reviewed the top podcasts that appeared most frequently in the Spotify and Apple charts.
For each podcast, we checked whether the host of the podcast was a health and wellness influencer on Instagram, TikTok or YouTube. Separately, we also checked accounts for each influencer on the TIME100 Creators 2025 list. If we found that these podcast hosts and creators were health and wellness influencers but were not already included in our dataset of accounts, we collected their account data and added it to our dataset on Jan. 15 and 16, 2026. This process resulted in the addition of four influencer accounts – the vast majority of the accounts we found were already included in our dataset.
Account data collection
For each Instagram, TikTok and YouTube account that appeared in our health and wellness search results, we collected key account information including the account display name, username, bio text (or description text for YouTube), follower count, and up to 10 most recent posts. For the recent posts, we collected text data but not audio data or transcripts. Instagram and TikTok account data was collected using the Modash Raw API, which provides real-time data from public social media profiles, while YouTube account data was collected directly using the YouTube Data API. We ran the account data collection pipeline for all 46,148 accounts as soon as they appeared in our search results from Sept. 19 to Oct. 9, 2025.
Removing inactive accounts
To ensure we were only including accounts that were currently active, we used the account data to remove accounts from our dataset that had fewer than three posts in the last 90 days since account collection. After removing these inactive accounts, we had 35,325 accounts to analyze, including 18,581 from Instagram, 15,469 from TikTok and 1,275 from YouTube.
Health and wellness influencer verification
Next, we verified whether each of the 35,325 accounts we had collected belonged to health and wellness influencers. We were primarily concerned with two criteria: Did they regularly discuss health or wellness information? And do these accounts belong to individuals, rather than organizations or businesses?’
To determine the extent to which these accounts had relevant content, researchers used the health and wellness definition provided above. Health and wellness information can include testimonials, commentary, advice, and product recommendations from conventional or alternative medicine as well as day-to-day healthy living. To be included, each account needed to discuss health and wellness topics in at least 30% of their 10 most recent posts. If an account appears to belong to a business or organization and not to individuals, then we did not label them as health and wellness influencers. After finalizing the health and wellness influencer definition, two members of the research team labeled a random sample of 722 accounts from our set of Instagram, TikTok and YouTube accounts. For each account, the coders determined whether the account belonged to a health and wellness influencer, as defined above. The coders reached 88% agreement (Cohen’s kappa = 0.752), and all instances of disagreement between coders were resolved by a third member of the research team who was familiar with the health and wellness influencer definition.
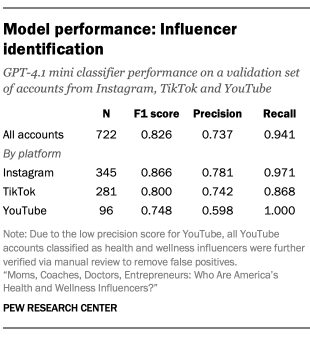
OpenAI’s GPT-4.1 mini model was then used to classify all 35,325 active social media accounts in our dataset. For each account, we prompted the model with a codebook that included details about our health and wellness influencer definition, along with the account’s bio text, username, and text from up to 10 of their most recent posts. Refer to the prompt for more information about model input and the health and wellness influencer definition. Based on the human-annotated validation dataset, the model achieved 79% accuracy and an F1 score of 0.826. Refer to the “Model performance: Influencer identification” table for detailed performance metrics.
Overall, the machine classifier’s recall score was higher than its precision score, suggesting that the set labeled as health and wellness influencers included false positives. We found that false positives were particularly prevalent for YouTube accounts compared with the other two platforms. To mitigate this, one member of the research team who had previously been trained on identifying these influencers manually reviewed all YouTube accounts that were classified as health and wellness influencers. Based on this manual review, we removed any false positive YouTube accounts that were not health and wellness influencers from our dataset.
Based on this analysis, 8,428 accounts of our original set of 35,325 were classified as belonging to a health and wellness influencer.
Influencer account matching
Our data collection process took place on an account-level basis, but many influencers have a presence across multiple sites. For example, one individual influencer with a consistent online persona might maintain popular accounts on both Instagram and TikTok. Therefore, to match influencers across sites, we used two different data sources: 1) links to other accounts found in the bio of each account we collected and 2) Modash influencer profile reports.
For each health and wellness influencer account in our dataset, we collected any links that were available in the account bio. For bios that included a link to an Instagram, TikTok or YouTube account, we checked whether the linked account was already available in our dataset. If the linked account was in our existing dataset, then the two accounts were marked as owned by the same influencer. If not, then the linked account was added to our dataset before being marked as owned by the same influencer as the original account. In cases where the linked account was previously labeled as not being a health and wellness account, the influencer was removed from our final dataset.
Instagram, TikTok and YouTube limit the number of links that a user can add to their bio. For this reason, some influencer bios include links to a landing page that aggregates many links related to that influencer, rather than linking to their other social media accounts in their bios directly. These sites, known as “microsites,” are common among content creators. To match more influencer accounts across sites, we collected data from microsites linked in account bios for the following microsite providers: Linktree, Stan Store, Beacons, hoo.be, Milkshake and Bio Sites. These were the most common sites used by the influencers in our dataset that were straightforward to collect with automated methods. We identified Instagram, TikTok and YouTube account links that were available on these microsites and marked them as belonging to the same influencer as the original account.
Finally, we also matched accounts across sites using influencer profile reports from Modash (the same social media data provider used for account search and data collection) using their Discovery API. This report includes an influencer’s contact details, which contains information on their known social media accounts. We used this information to further match and consolidate the accounts in our collection to the individual influencers that own them.
Data from additional accounts identified during the account consolidation process was collected from Jan. 22 to 27, 2026, using the account data collection process described above. In total, this account matching process identified 5,441 additional influencer accounts from the three social media sites that we studied.
At this stage, we conducted a secondary language filtering step to ensure that all remaining influencer accounts posted primarily in English. We used the langdetect Python package to remove influencers for which more than 20% of recent posts across all accounts were in a language other than English.
These processes resulted in a final dataset of 6,828 influencers for analysis. From these influencers, we collected information on 12,800 accounts that consisted of:
- 5,766 Instagram accounts
- 4,124 TikTok accounts
- 2,910 YouTube accounts
A complete list of the influencers in our final dataset, including their handles across the three sites that we studied, is available to download as a CSV.
Analysis of health and wellness influencer characteristics
To learn more about health and wellness influencers and how they describe themselves, we also analyzed the content of each influencer’s profile bio – including text and links – across Instagram, TikTok and YouTube.
Professions and credentials classification
Many health and wellness influencers in our dataset mention their profession or credentials in their profile bios, often to signal authority to speak on certain health and wellness topics.
After several rounds of qualitative reviews, we identified eight credentials that were frequently mentioned in these influencers’ bios: activist, athlete, author, coach, entrepreneur, health care professional, researcher, and life experience with certain health and wellness issues. For influencers with health care professional credentials, we further identified the type of health profession as conventional medicine; complementary, alternative, and integrative health; mental health; dieticians and nutritionists; and allied health professionals like physical therapists and pharmacists. Additionally, we identified accounts whose bio suggest they host a podcast.
Two members of the research team then labeled the credentials of a random sample of 500 influencers from our dataset. For each influencer, the coders reviewed the combined account bios of each influencer and assigned credential labels based on our list of health and wellness credentials. The credentials were not mutually exclusive; for example, an influencer could be labeled as both a coach and an author. Some influencers did not include any credentials in their bio. For this group, we assigned a “no credentials” code.
Ultimately, the two coders reached an average of 97% agreement (Cohen’s kappa = 0.817) across the credentials. All instances of disagreement between coders were resolved by a third member of the research team who was familiar with the credential categories and definitions.
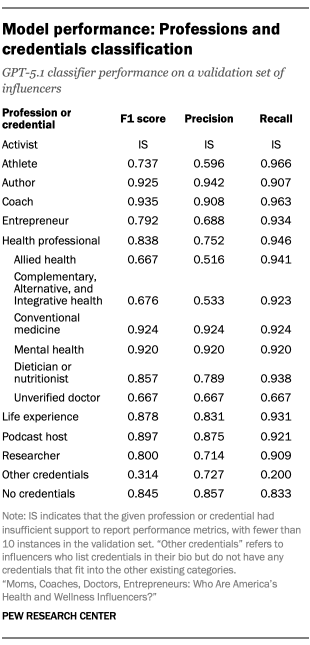
OpenAI’s GPT-5.1 model was then used to identify the credentials of all influencers in our dataset. For each influencer, we prompted the model with a codebook that included details about our profession and credential cues, along with the influencer’s bio text, username and influencer display name for all available accounts. Refer to the prompt for more information about model input and the profession and credential definitions. We did not classify professions or credentials for influencers whose online presence included multiple people (such as an influencer duo or couple).
Based on the human-annotated validation dataset, the model achieved a weighted average accuracy of 94% and a weighted average F1 score of 0.831. Performance metrics by class are available in the “Model performance: Professions and credentials classification” table.
Gender classification
Most influencers portray themselves with text or images that the average person can perceive as gendered. In this analysis, we measure “perceived” gender based on four cues: pronouns, influencer name, explicit gendered identity cues (such as “father” or an emoji of a woman doctor), and images available in an influencer’s profile bios.
Using a similar approach to the professions coding, two members of the research team labeled the perceived gender for a random sample of 500 influencers from our dataset using the materials in their combined profile bios. The coders then marked an influencer as either a man, woman, non-binary person, “multiple genders” (if the accounts belonged to multiple people with different genders), or “unsure” if the influencer’s gender could not be determined.
Pronouns that influencers use to describe themselves were used as a first determinant of gender whenever possible. However, when pronouns were not available in the bio text, gender was determined from explicit profile cues, followed by the gender of the influencer’s name, and finally, by the influencer’s profile picture if no other cues were available. Influencers who did not display any of the above cues were coded as “unsure.”
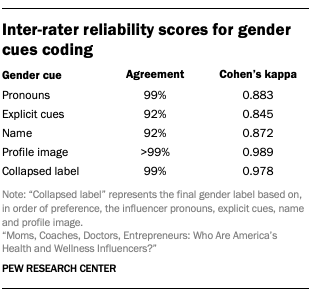
The two coders ultimately reached over 99% agreement on the final gender labels and all instances of disagreement were resolved by a third member of the research team. Refer to the “Inter-rater reliability scores for gender cue coding” table for more details.
OpenAI’s GPT-5.1 model was again used to identify the perceived gender of all influencers in our dataset. For each influencer, we prompted the model with a codebook that included gender cue classification instructions, along with the influencer’s bio text, username, and influencer display name for all available accounts. We used only text-based classification at this stage, so the profile picture was not included. Refer to the prompt for more information about model input and the gender cue definitions. Based on the human-annotated validation dataset, the model achieved over 99% accuracy and a weighted average F1 score of 0.987, with similarly high performance by class for men and women.9
Using the GPT-5.1-generated labels, we determined the final gender for each influencer in our dataset by aggregating the parsed cues as described above. About 9% of influencer genders were determined by pronouns available in the influencer’s bio texts, 35% were determined with explicit gender cues, and 41% were determined by the influencer’s name. For about 16% of influencers, gender could not be determined based on text-based review of the accounts alone. For these influencers, two members of the research team manually reviewed the influencer’s accounts and assigned a gender label based on the influencer’s profile picture and other available cues.
Bio link analysis
Influencers often use the links in their bios or microsites to link to their presence on other sites, including outreach channels like podcasts or newsletters and accounts on other social media sites. We used these links to identify additional sites and channels that other steps in our analysis did not capture.
We checked whether influencers linked to known podcast domains in their bios, including on microsites. If an influencer linked to a show listing on Spotify, Apple Podcasts, Podlink, Amazon Music, Downcast, Overcast, Fountain, Castbox, Audible, iHeart, TrueFans, iVoox, Pandora, Podcast Addict, Deezer, Goodpods, Player FM, podStation, Global Player, Podurama, Anytime Podcast Player, RSSRadio Podcast Player, gPodder, Podcast App, Podcast Guru, Podcast Republic, Podverse, Podbean, Castamatic, Castro, TuneIn, Pocket Casts or CurioCaster, we marked them as a podcast host. We did not include links to individual episodes as an indication for podcast affiliation. This process identified 272 podcast hosts.
We also used influencers’ bio links to determine whether they maintained a presence on other social media sites outside of YouTube, Instagram and TikTok. We identified account links from 14 additional domains – X (Twitter), Facebook, Bluesky, LinkedIn, Threads, Telegram, Truth Social, Discord, Twitch, Rumble, Gab, Gettr, Bitchute and Snapchat – as an indicator of their presence in these sites. We excluded links to individual posts.
We used the same approach to determine whether influencers maintained a presence on two newsletter outreach channels, Substack and Medium.
Handling invalid health and wellness influencers
Throughout the various stages of manual review outlined above, we also took note of “false positive” influencers who were present in our influencer dataset but did not fit our definition of health and wellness influencers. These erroneous accounts are attributable to the automated account classification process, which labeled some accounts as health and wellness influencers that do not meet our standards for inclusion upon close human review. This type of error was expected based on the model performance metrics reported above that indicate higher recall than precision. After removing these false positives, our final dataset for this analysis included 6,828 health and wellness influencers.


