

As the nation approaches its 250th birthday, the American public’s mood is sour – but with some signs of enduring optimism.
In Pew Research Center surveys over the past year, most people have told us they are dissatisfied with the way things are going in the United States and that they think the country’s best days are behind us.
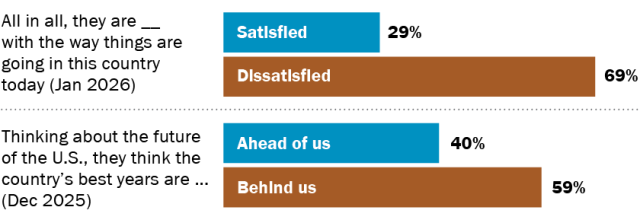
| Satisfied | Dissatisfied | |
|---|---|---|
| All in all, they are __ with the way things are going in this country today (Jan 2026) | 29% | 69% |
| Ahead of us | Behind us | |
| Thinking about the future of the U.S., they think the country’s best years are … (Dec 2025) | 40% | 59% |
In recent decades, Americans also have grown less trustful of each other and of institutions including the federal government, both major political parties, the mainstream media, and colleges and universities.
Compared with people in other countries, more Americans express gloomy views about how their democracy is working and doubts about whether fellow citizens have good morals.
And when asked to look ahead to 2050, upward of half of U.S. adults say they think the economy will be weaker, the U.S. will be less important in the world, the country will be more politically divided, and the American system of government will work worse than it does today.
Still, many Americans express some optimism when they are asked to think about the future in general terms.
Most people say they feel “hopeful” when they think about the future, and 54% say they feel “happy” when they ponder days to come.
About as many Americans say they are optimistic (48%) as say they are pessimistic (51%) about the future of the country as a whole.
And even on some questions where the balance of opinion leans negative, there are signs of recent improvement in the public’s mood.

| The nation’s economy will be stronger than today | The nation will be less politically divided than today | |
|---|---|---|
| 04/2023 | 32% | 21% |
| 04/2026 | 43% | 33% |
Compared with our polling in 2023, more U.S. adults now think that in the coming decades, the country’s economy will grow stronger and its political divisions will become less sharp.
And satisfaction with the country’s direction was lower during much of the period from 2020 to 2024 than it was during 2025 and at the start of this year.
Feelings about the country’s direction are closely linked with people’s political leanings. During President Donald Trump’s second term, Republicans have been much happier than Democrats with how things are going. A few short years ago, when Joe Biden was president, Democrats tended to be more positive than Republicans.

| Rep/lean Rep | Dem/lean Dem | |
|---|---|---|
| 01/2026 | 54% | 8% |
| 01/2022 | 10% | 29% |
And views about the country’s future are also connected with age. When asked to look ahead to what things might be like in the year 2050, the youngest U.S. adults express more pessimistic views than the country’s older adults do.
This report focuses on questions we’ve asked in recent years that shed light on how the country is feeling about itself on the eve of a milestone anniversary. We also look at some questions we asked in a new survey, conducted in April 2026, asking Americans about their expectations for what the country will be like in 2050, roughly 25 years from now.
Trends in the public’s mood
As 2026 dawned, 29% of U.S. adults said they were satisfied with how things were going in the country, while 69% were dissatisfied.
The number of people saying they are satisfied with how things are going has rebounded somewhat since a recent low point in the COVID-19 pandemic. But more Americans have expressed dissatisfaction than satisfaction with the country’s direction for more than two decades.

| End Field Date | Satisfied | Dissatisfied |
|---|---|---|
| 11/10/1991 | 34 | 61 |
| 1/6/1992 | 28 | 68 |
| 1/6/1993 | 39 | 50 |
| 5/27/1993 | 22 | 71 |
| 9/15/1993 | 20 | 75 |
| 10/15/1993 | 22 | 73 |
| 3/21/1994 | 24 | 71 |
| 7/27/1994 | 24 | 73 |
| 4/9/1995 | 23 | 74 |
| 6/11/1995 | 25 | 73 |
| 10/30/1995 | 23 | 73 |
| 3/31/1996 | 28 | 70 |
| 7/28/1996 | 29 | 67 |
| 1/12/1997 | 38 | 58 |
| 8/10/1997 | 49 | 46 |
| 9/11/1997 | 45 | 49 |
| 1/18/1998 | 46 | 50 |
| 2/2/1998 | 59 | 37 |
| 8/2/1998 | 50 | 44 |
| 8/24/1998 | 55 | 41 |
| 9/10/1998 | 54 | 42 |
| 11/19/1998 | 46 | 44 |
| 1/17/1999 | 53 | 41 |
| 9/9/1999 | 56 | 39 |
| 5/13/2000 | 48 | 43 |
| 6/28/2000 | 47 | 45 |
| 9/10/2000 | 51 | 41 |
| 1/7/2001 | 55 | 41 |
| 2/19/2001 | 46 | 43 |
| 3/18/2001 | 47 | 45 |
| 6/17/2001 | 43 | 52 |
| 9/4/2001 | 41 | 53 |
| 9/25/2001 | 57 | 34 |
| 3/10/2002 | 50 | 40 |
| 5/16/2002 | 44 | 44 |
| 8/25/2002 | 47 | 44 |
| 9/15/2002 | 41 | 55 |
| 11/10/2002 | 41 | 48 |
| 1/12/2003 | 44 | 50 |
| 4/16/2003 | 50 | 41 |
| 8/5/2003 | 40 | 53 |
| 10/20/2003 | 38 | 56 |
| 12/17/2003 | 44 | 47 |
| 1/15/2004 | 45 | 48 |
| 2/29/2004 | 39 | 55 |
| 5/9/2004 | 33 | 61 |
| 7/18/2004 | 38 | 55 |
| 10/15/2004 | 36 | 58 |
| 12/15/2004 | 39 | 54 |
| 1/9/2005 | 40 | 54 |
| 2/21/2005 | 38 | 56 |
| 5/28/2005 | 39 | 57 |
| 7/18/2005 | 35 | 58 |
| 10/10/2005 | 29 | 65 |
| 11/27/2005 | 34 | 59 |
| 1/8/2006 | 34 | 61 |
| 3/6/2006 | 32 | 63 |
| 5/15/2006 | 29 | 65 |
| 7/19/2006 | 30 | 65 |
| 10/4/2006 | 30 | 63 |
| 11/12/2006 | 28 | 64 |
| 12/10/2006 | 28 | 65 |
| 1/9/2007 | 30 | 63 |
| 1/15/2007 | 32 | 61 |
| 2/15/2007 | 30 | 61 |
| 10/23/2007 | 28 | 66 |
| 12/30/2007 | 27 | 66 |
| 2/2/2008 | 24 | 70 |
| 3/15/2008 | 22 | 72 |
| 5/25/2008 | 18 | 76 |
| 6/29/2008 | 19 | 76 |
| 7/27/2008 | 19 | 74 |
| 8/10/2008 | 21 | 74 |
| 9/14/2008 | 25 | 69 |
| 10/12/2008 | 11 | 86 |
| 12/8/2008 | 13 | 83 |
| 1/11/2009 | 20 | 73 |
| 4/21/2009 | 23 | 70 |
| 5/12/2009 | 34 | 58 |
| 6/14/2009 | 30 | 64 |
| 7/26/2009 | 28 | 66 |
| 8/17/2009 | 28 | 65 |
| 8/27/2009 | 28 | 65 |
| 9/15/2009 | 30 | 64 |
| 10/4/2009 | 25 | 67 |
| 11/8/2009 | 25 | 67 |
| 1/10/2010 | 27 | 69 |
| 2/9/2010 | 23 | 71 |
| 3/14/2010 | 23 | 71 |
| 3/21/2010 | 25 | 69 |
| 4/5/2010 | 31 | 63 |
| 4/26/2010 | 29 | 66 |
| 5/16/2010 | 28 | 64 |
| 6/27/2010 | 27 | 64 |
| 9/6/2010 | 25 | 71 |
| 9/26/2010 | 30 | 63 |
| 11/7/2010 | 23 | 69 |
| 12/5/2010 | 21 | 72 |
| 1/9/2011 | 23 | 71 |
| 2/7/2011 | 26 | 68 |
| 3/14/2011 | 22 | 73 |
| 5/2/2011 | 32 | 60 |
| 5/8/2011 | 30 | 62 |
| 6/19/2011 | 23 | 73 |
| 7/24/2011 | 17 | 79 |
| 8/21/2011 | 17 | 79 |
| 10/4/2011 | 17 | 78 |
| 1/16/2012 | 21 | 75 |
| 2/12/2012 | 28 | 66 |
| 4/15/2012 | 24 | 69 |
| 6/3/2012 | 29 | 64 |
| 6/17/2012 | 28 | 68 |
| 7/9/2012 | 31 | 64 |
| 10/21/2012 | 32 | 61 |
| 12/9/2012 | 33 | 62 |
| 12/19/2012 | 25 | 68 |
| 1/13/2013 | 30 | 66 |
| 2/18/2013 | 31 | 64 |
| 5/5/2013 | 30 | 65 |
| 7/21/2013 | 27 | 67 |
| 10/13/2013 | 14 | 81 |
| 11/6/2013 | 21 | 75 |
| 1/19/2014 | 26 | 69 |
| 2/26/2014 | 28 | 66 |
| 4/27/2014 | 29 | 65 |
| 7/14/2014 | 29 | 68 |
| 8/24/2014 | 24 | 72 |
| 9/9/2014 | 25 | 71 |
| 10/20/2014 | 29 | 65 |
| 11/9/2014 | 27 | 68 |
| 12/7/2014 | 26 | 71 |
| 1/11/2015 | 31 | 66 |
| 2/22/2015 | 33 | 62 |
| 3/29/2015 | 31 | 64 |
| 5/18/2015 | 29 | 67 |
| 7/20/2015 | 31 | 64 |
| 9/27/2015 | 27 | 69 |
| 10/4/2015 | 27 | 67 |
| 12/13/2015 | 25 | 72 |
| 1/14/2016 | 25 | 70 |
| 3/26/2016 | 31 | 65 |
| 4/19/2016 | 26 | 70 |
| 6/26/2016 | 24 | 71 |
| 8/16/2016 | 31 | 66 |
| 10/25/2016 | 33 | 63 |
| 12/5/2016 | 30 | 65 |
| 1/9/2017 | 28 | 68 |
| 2/12/2017 | 30 | 65 |
| 4/11/2017 | 30 | 66 |
| 7/9/2017 | 28 | 67 |
| 10/30/2017 | 26 | 70 |
| 12/4/2017 | 27 | 68 |
| 1/15/2018 | 32 | 62 |
| 3/14/2018 | 30 | 66 |
| 5/1/2018 | 33 | 62 |
| 6/12/2018 | 34 | 61 |
| 9/24/2018 | 33 | 61 |
| 8/4/2019 | 27 | 72 |
| 10/13/2019 | 28 | 71 |
| 11/11/2019 | 31 | 69 |
| 3/24/2020 | 33 | 66 |
| 4/12/2020 | 31 | 68 |
| 6/22/2020 | 12 | 87 |
| 8/2/2020 | 12 | 87 |
| 10/5/2020 | 18 | 82 |
| 11/17/2020 | 22 | 77 |
| 3/7/2021 | 33 | 66 |
| 9/19/2021 | 26 | 74 |
| 9/26/2021 | 25 | 74 |
| 1/17/2022 | 21 | 78 |
| 5/1/2022 | 24 | 75 |
| 8/14/2022 | 18 | 81 |
| 10/16/2022 | 21 | 79 |
| 11/27/2022 | 24 | 75 |
| 1/24/2023 | 22 | 78 |
| 4/2/2023 | 19 | 80 |
| 6/11/2023 | 21 | 78 |
| 7/16/2023 | 22 | 77 |
| 12/3/2023 | 22 | 77 |
| 1/21/2024 | 21 | 78 |
| 5/19/2024 | 22 | 78 |
| 7/7/2024 | 18 | 82 |
| 8/11/2024 | 24 | 75 |
| 10/6/2024 | 23 | 76 |
| 11/17/2024 | 29 | 70 |
| 2/2/2025 | 38 | 61 |
| 3/16/2025 | 34 | 65 |
| 5/4/2025 | 32 | 67 |
| 8/10/2025 | 34 | 65 |
| 10/16/2025 | 27 | 72 |
| 1/26/2026 | 29 | 69 |
Similarly, over the past decade we’ve continually found that more Americans think their side has been losing, rather than winning, on the political issues that matter to them.

| Losing more often than winning | Winning more often than losing | |
|---|---|---|
| 2016 | 59% | 35% |
| 2018 | 67% | 29% |
| 2019 | 62% | 34% |
| 2020 | 56% | 41% |
| 2021 | 65% | 29% |
| 2022 | 72% | 24% |
| 2024 | 71% | 25% |
| 2026 | 63% | 33% |
And in January 2026, the share of Americans saying they think the year ahead will be better than the previous year was lower than in any of our surveys dating back to 2020.

| Better | Worse | |
|---|---|---|
| 2020 | 55% | 43% |
| 2021 | 67% | 32% |
| 2022 | 61% | 38% |
| 2023 | 57% | 43% |
| 2024 | 55% | 45% |
| 2025 | 55% | 45% |
| 2026 | 50% | 48% |
Signs of optimism
At the same time, about as many people say they are optimistic as say they are pessimistic when they think about the future of the United States.
And while many Americans say they feel scared or sad when they think about the future, substantial shares also say they feel hopeful and happy.

| Question | Yes | No |
|---|---|---|
| When you think about the future, do you feel hopeful? | 68% | 31% |
| When you think about the future, do you feel happy? | 54% | 43% |
| Thinking about the future of the U.S., would you say you are … | 48% | 51% |
Looking ahead to 2050
In April 2026, we asked Americans to look ahead to the year 2050 and share their expectations about the country’s economic outlook, its place in the world and several other topics.
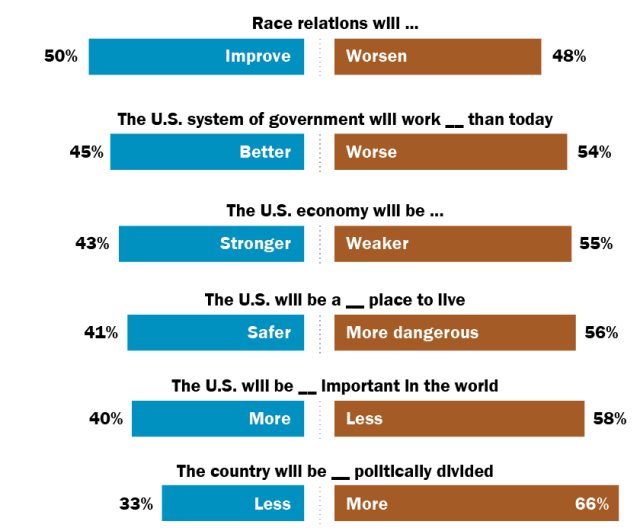
| Race relations will improve | Race relations will get worse |
|---|---|
| 50% | 48% |
| The U.S. system of government will work better than today | The U.S. system of government will work worse than today |
| 45% | 54% |
| The U.S. economy will be stronger | The U.S. economy will be weaker |
| 43% | 55% |
| The U.S. will be a safer place to live | The U.S. will be a more dangerous place to live |
| 41% | 56% |
| The U.S. will be more important in the world | The U.S. will be less important in the world |
| 40% | 58% |
| The country will be less politically divided | The country will be more politically divided |
| 33% | 66% |
The public is divided over whether race relations will improve. Half of Americans say race relations will get better in the next 25 years, and roughly the same share say they will get worse.
On the other questions, we find more pessimists than optimists. Two-thirds of U.S. adults think that by 2050 the country will have become more politically divided. More than half say they think the U.S. will play a less important role in the world, be less prosperous, become a more dangerous place to live and have a worse system of government.
But the questions we can track over time indicate that the nation’s expectations for the future have improved in recent years. Since 2023, there has been a 13 percentage point rise in the share of Americans who say the U.S. will be more important in the world by 2050. There also has been a 12-point increase in the share saying the country will be less politically divided and an 11-point rise in the share who expect the economy to grow stronger.
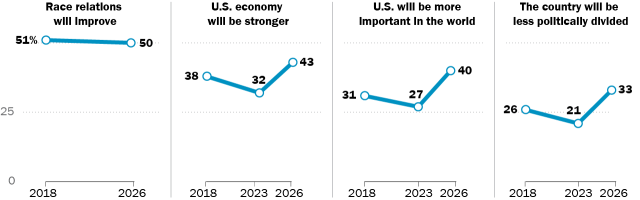
| Year | Race relations will improve | U.S. economy will be stronger | U.S. will be more important in the world | The country will be less politically divided |
|---|---|---|---|---|
| 2018 | 51% | 38% | 31% | 26% |
| 2023 | — | 32% | 27% | 21% |
| 2026 | 50% | 43% | 40% | 33% |
(We did not ask the question about race relations in the 2023 survey, and we have never previously asked the questions about how government works or whether the U.S. will be a safer place to live in 2050.)
National mood linked with partisanship
The way people view the state of the nation is often linked with their political allegiances. Republicans and independents who lean toward the Republican Party tend to express very different views from Democrats and Democratic-leaning independents, and this aligns with who is in the White House.
For instance, during both the first and second Trump administrations, more Republicans than Democrats have expressed satisfaction with the way things are going in the country. By contrast, during both the Obama and Biden administrations, more Democrats than Republicans were content with the country’s direction.
Looking back further, Republicans also expressed higher levels of satisfaction than Democrats during the George W. Bush administration, while Democrats were consistently more satisfied than Republicans during the Clinton administration.

| End field date | Rep/lean Rep | Dem/lean Dem |
|---|---|---|
| 11/10/91 | 47 | 22 |
| 1/6/92 | 43 | 14 |
| 1/6/93 | 42 | 38 |
| 5/27/93 | 16 | 30 |
| 9/15/93 | 14 | 27 |
| 10/15/93 | — | — |
| 3/21/94 | 14 | 34 |
| 7/27/94 | 19 | 29 |
| 4/9/95 | 21 | 27 |
| 6/11/95 | 23 | 29 |
| 10/30/95 | 20 | 28 |
| 3/31/96 | 24 | 32 |
| 7/28/96 | 22 | 37 |
| 1/12/97 | 32 | 46 |
| 8/10/97 | 46 | 56 |
| 9/11/97 | 35 | 56 |
| 1/18/98 | 41 | 51 |
| 2/2/98 | — | — |
| 8/2/98 | 43 | 59 |
| 8/24/98 | 47 | 64 |
| 9/10/98 | 44 | 64 |
| 11/19/98 | 40 | 53 |
| 1/17/99 | 47 | 58 |
| 9/9/99 | — | — |
| 5/13/00 | — | — |
| 6/28/00 | 40 | 55 |
| 9/10/00 | 43 | 60 |
| 1/7/01 | 47 | 63 |
| 2/19/01 | 54 | 42 |
| 3/18/01 | 54 | 42 |
| 6/17/01 | 56 | 35 |
| 9/4/01 | 57 | 31 |
| 9/25/01 | 68 | 49 |
| 3/10/02 | 62 | 42 |
| 5/16/02 | 53 | 39 |
| 8/25/02 | — | — |
| 9/15/02 | — | — |
| 11/10/02 | 56 | 29 |
| 1/12/03 | — | — |
| 4/16/03 | 74 | 34 |
| 8/5/03 | 61 | 26 |
| 10/20/03 | 55 | 23 |
| 12/17/03 | 69 | 25 |
| 1/15/04 | — | — |
| 2/29/04 | 60 | 21 |
| 5/9/04 | 56 | 16 |
| 7/18/04 | 64 | 19 |
| 10/15/04 | — | — |
| 12/15/04 | 65 | 16 |
| 1/9/05 | 66 | 17 |
| 2/21/05 | 63 | 18 |
| 5/28/05 | — | — |
| 7/18/05 | 58 | 17 |
| 10/10/05 | 52 | 14 |
| 11/27/05 | — | — |
| 1/8/06 | 59 | 17 |
| 3/6/06 | 58 | 14 |
| 5/15/06 | — | — |
| 7/19/06 | 50 | 15 |
| 10/4/06 | 56 | 11 |
| 11/12/06 | 49 | 17 |
| 12/10/06 | 50 | 14 |
| 1/9/07 | 53 | 15 |
| 1/15/07 | 56 | 17 |
| 2/15/07 | — | — |
| 10/23/07 | 43 | 20 |
| 12/30/07 | 42 | 17 |
| 2/2/08 | 36 | 16 |
| 3/15/08 | — | — |
| 5/25/08 | 28 | 10 |
| 6/29/08 | 29 | 12 |
| 7/27/08 | 29 | 13 |
| 8/10/08 | 29 | 15 |
| 9/14/08 | 40 | 14 |
| 10/12/08 | 18 | 6 |
| 12/8/08 | 17 | 11 |
| 1/11/09 | 23 | 16 |
| 4/21/09 | 13 | 31 |
| 5/12/09 | 20 | 43 |
| 6/14/09 | 18 | 40 |
| 7/26/09 | 17 | 40 |
| 8/17/09 | 16 | 41 |
| 8/27/09 | 14 | 43 |
| 9/15/09 | 19 | 41 |
| 10/4/09 | 12 | 37 |
| 11/8/09 | 17 | 34 |
| 1/10/10 | 14 | 40 |
| 2/9/10 | 13 | 32 |
| 3/14/10 | 12 | 33 |
| 3/21/10 | 16 | 34 |
| 4/5/10 | — | — |
| 4/26/10 | 15 | 43 |
| 5/16/10 | — | — |
| 6/27/10 | — | — |
| 9/6/10 | 13 | 35 |
| 9/26/10 | — | — |
| 11/7/10 | 13 | 33 |
| 12/5/10 | 11 | 26 |
| 1/9/11 | 15 | 31 |
| 2/7/11 | 14 | 38 |
| 3/14/11 | 15 | 28 |
| 5/2/11 | — | — |
| 5/8/11 | — | — |
| 6/19/11 | 14 | 32 |
| 7/24/11 | 8 | 25 |
| 8/21/11 | 13 | 20 |
| 10/4/11 | 9 | 25 |
| 1/16/12 | 12 | 31 |
| 2/12/12 | 11 | 42 |
| 4/15/12 | 13 | 34 |
| 6/3/12 | 13 | 44 |
| 6/17/12 | 15 | 39 |
| 7/9/12 | 15 | 44 |
| 10/21/12 | — | — |
| 12/9/12 | 13 | 48 |
| 12/19/12 | — | — |
| 1/13/13 | 13 | 44 |
| 2/18/13 | 13 | 47 |
| 5/5/13 | 18 | 40 |
| 7/21/13 | 14 | 39 |
| 10/13/13 | 7 | 20 |
| 11/6/13 | — | — |
| 1/19/14 | 16 | 37 |
| 2/26/14 | 17 | 38 |
| 4/27/14 | 15 | 43 |
| 7/14/14 | 13 | 43 |
| 8/24/14 | — | — |
| 9/9/14 | 11 | 38 |
| 10/20/14 | 15 | 40 |
| 11/9/14 | 15 | 40 |
| 12/7/14 | 12 | 38 |
| 1/11/15 | 13 | 47 |
| 2/22/15 | 15 | 51 |
| 3/29/15 | 15 | 45 |
| 5/18/15 | 15 | 41 |
| 7/20/15 | 14 | 46 |
| 9/27/15 | 12 | 41 |
| 10/4/15 | 15 | 41 |
| 12/13/15 | 15 | 36 |
| 1/14/16 | 10 | 42 |
| 3/26/16 | 13 | 46 |
| 4/19/16 | 13 | 40 |
| 6/26/16 | 8 | 38 |
| 8/16/16 | 12 | 49 |
| 10/25/16 | 11 | 52 |
| 12/5/16 | 21 | 37 |
| 1/9/17 | 24 | 33 |
| 2/12/17 | 49 | 16 |
| 4/11/17 | 49 | 16 |
| 7/9/17 | 49 | 11 |
| 10/30/17 | 43 | 14 |
| 12/4/17 | 49 | 15 |
| 1/15/18 | 59 | 14 |
| 3/14/18 | 53 | 9 |
| 5/1/18 | 57 | 15 |
| 6/12/18 | 60 | 15 |
| 9/24/18 | 59 | 14 |
| 8/4/19 | 50 | 9 |
| 10/13/19 | 46 | 12 |
| 11/11/19 | 49 | 16 |
| 3/24/20 | 58 | 12 |
| 4/12/20 | 55 | 10 |
| 6/22/20 | 19 | 7 |
| 8/2/20 | 18 | 7 |
| 10/5/20 | 30 | 7 |
| 11/17/20 | 23 | 22 |
| 3/7/21 | 17 | 47 |
| 9/19/21 | 12 | 38 |
| 9/26/21 | 10 | 38 |
| 1/17/22 | 10 | 29 |
| 5/1/22 | 10 | 35 |
| 8/14/22 | 10 | 24 |
| 10/16/22 | 9 | 31 |
| 11/27/22 | 10 | 39 |
| 1/24/23 | 11 | 32 |
| 4/2/23 | 9 | 29 |
| 6/11/23 | 11 | 32 |
| 7/16/23 | 10 | 35 |
| 12/3/23 | 11 | 35 |
| 1/21/24 | 10 | 32 |
| 5/19/24 | 10 | 34 |
| 7/7/24 | 8 | 27 |
| 8/11/24 | 10 | 39 |
| 10/6/24 | 10 | 38 |
| 11/17/24 | 35 | 24 |
| 2/2/25 | 65 | 12 |
| 3/16/25 | 60 | 9 |
| 5/4/25 | 58 | 8 |
| 8/10/25 | 60 | 11 |
| 10/16/25 | 48 | 8 |
| 1/26/26 | 54 | 8 |
People in both partisan coalitions also tend to express more optimism about the year ahead when their favored party controls the White House.

| Rep/lean Rep | Dem/lean Dem | |
|---|---|---|
| 2020 | 78% | 36% |
| 2021 | 48% | 83% |
| 2022 | 46% | 71% |
| 2023 | 43% | 71% |
| 2024 | 43% | 66% |
| 2025 | 89% | 21% |
| 2026 | 77% | 25% |
And Americans generally have been more inclined to say their side is “winning” on the political issues that matter to them when their party has the presidency than when the opposing party controls the White House.
The swings on this question are especially pronounced among Republicans. Just 15% of Republicans thought their side was winning more often than losing during the last year of the Biden administration, but this jumped to 60% following the first year of Trump’s second term. By comparison, fewer than half of Democrats have felt like their side is winning even during Democratic administrations.

| Rep/lean Rep | Dem/lean Dem | |
|---|---|---|
| 2016 | 22% | 47% |
| 2018 | 44% | 20% |
| 2019 | 54% | 19% |
| 2020 | 69% | 18% |
| 2021 | 22% | 36% |
| 2022 | 17% | 31% |
| 2024 | 15% | 36% |
| 2026 | 60% | 10% |
But Republicans and Democrats express similar views on some questions. When asked to look ahead to 2050, most people in both parties think the country will be more politically divided than it is today. And roughly similar shares in both parties say they think the U.S. system of government will work worse than it does today.
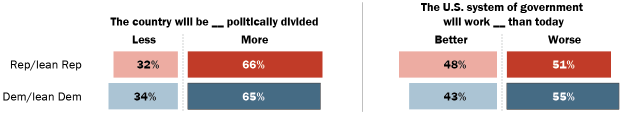
| The country will be less politically divided | The country will be more politically divided | The U.S. system of government will work better than today | The U.S. system of government will work worse than today | |
|---|---|---|---|---|
| Rep/lean Rep | 32% | 66% | 48% | 51% |
| Dem/lean Dem | 34% | 65% | 43% | 55% |
Age gaps in the nation’s mood
When asked to look ahead to what things will be like in the U.S. in 2050, the nation’s youngest adults tend to express more pessimistic views than the country’s older adults.
For example, compared with people ages 65 and older, fewer adults under age 30 say race relations will improve, the government will work better or the economy will be stronger. Young adults are also less inclined than older people to say that overall, they are optimistic when they think ahead to 2050.
| Ages 18-29 | 30-49 | 50-64 | 65+ | |
|---|---|---|---|---|
| Race relations will improve | 43 | 47 | 50 | 58 |
| They are very/somewhat optimistic | 42 | 46 | 51 | 55 |
| The U.S. system of government will work better | 37 | 42 | 46 | 53 |
| The U.S. economy will be stronger | 36 | 41 | 45 | 50 |
| The U.S. will be a safer place to live | 37 | 39 | 42 | 48 |
| The U.S. will be more important in the world | 41 | 35 | 42 | 42 |
| The country will be less politically divided | 24 | 31 | 35 | 41 |
| Ages 18-29 | 30-49 | 50-64 | 65+ | |
|---|---|---|---|---|
| Race relations will improve | 43% | 47% | 50% | 58% |
| They are very/somewhat optimistic | 42% | 46% | 51% | 55% |
| The U.S. system of government will work better | 37% | 42% | 46% | 53% |
| The U.S. economy will be stronger | 36% | 41% | 45% | 50% |
| The U.S. will be a safer place to live | 37% | 39% | 42% | 48% |
| The U.S. will be more important in the world | 41% | 35% | 42% | 42% |
| The country will be less politically divided | 24% | 31% | 35% | 41% |
On a variety of other questions, though, the differences between age groups are muted. Young people are not substantially different from older adults in overall levels of satisfaction with how things are going in the country, for example. And people ages 18 to 29 express higher levels of happiness about the future than those 65 and older.
| Ages 18-29 | 30-49 | 50-64 | 65+ | |
|---|---|---|---|---|
| They are satisfied with the way things are going in the country | 28 | 27 | 33 | 31 |
| The country’s best years are ahead of us | 41 | 34 | 46 | 42 |
| They are hopeful about the future | 66 | 66 | 68 | 71 |
| They are happy about the future | 59 | 56 | 54 | 48 |
| Their side is winning more than losing in politics | 33 | 31 | 35 | 36 |
| The year ahead will be better than last year | 52 | 47 | 54 | 49 |
| Ages 18-29 | 30-49 | 50-64 | 65+ | |
|---|---|---|---|---|
| They are satisfied with the way things are going in the country | 28% | 27% | 33% | 31% |
| The country’s best years are ahead of us | 41% | 34% | 46% | 42% |
| They are hopeful about the future | 66% | 66% | 68% | 71% |
| They are happy about the future | 59% | 56% | 54% | 48% |
| Their side is winning more than losing in politics | 33% | 31% | 35% | 36% |
| The year ahead will be better than last year | 52% | 47% | 54% | 49% |


