

People in higher-income countries are generally more likely to say their nation’s political system needs only minor or no changes, according to recent Pew Research Center surveys. Conversely, people in middle-income countries are more likely to say their political system needs major changes or complete reform.
The United States, however, is a notable exception to this pattern. Despite having the highest gross domestic product (GDP) per capita of any of our surveyed countries, 77% of Americans say the nation’s political system needs major changes or complete reform.
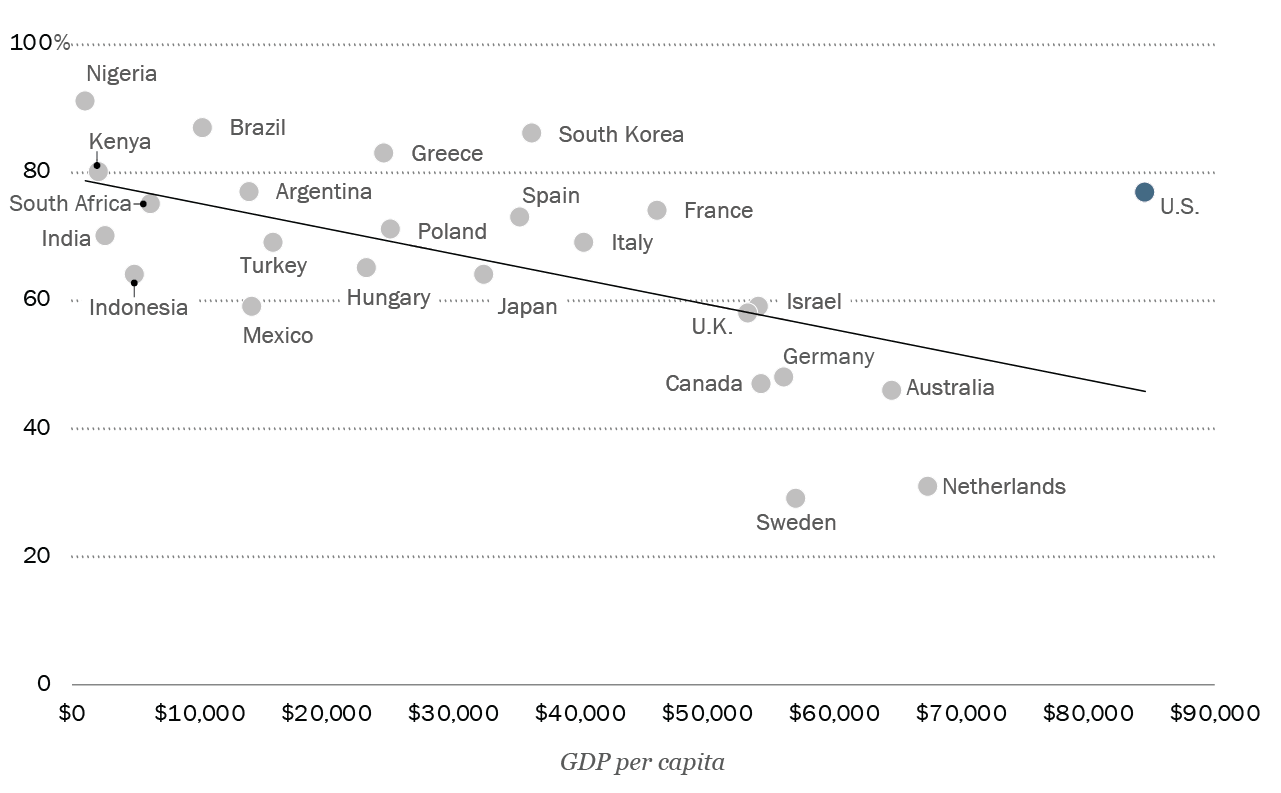
| Country | GDP per capita, in dollars | % who say their political system needs major changes or complete reform |
|---|---|---|
| Nigeria | 1084.2 | 91 |
| Kenya | 2132.4 | 80 |
| India | 2694.7 | 70 |
| Indonesia | 4925.4 | 64 |
| South Africa | 6267.2 | 75 |
| Brazil | 10310.5 | 87 |
| Argentina | 13969.8 | 77 |
| Mexico | 14185.8 | 59 |
| Turkey | 15892.7 | 69 |
| Hungary | 23292.3 | 65 |
| Greece | 24626.1 | 83 |
| Poland | 25103.6 | 71 |
| Japan | 32487.1 | 64 |
| Spain | 35326.8 | 73 |
| South Korea | 36238.6 | 86 |
| Italy | 40385.3 | 69 |
| France | 46103.1 | 74 |
| U.K. | 53246.4 | 58 |
| Israel | 54176.7 | 59 |
| Canada | 54340.3 | 47 |
| Germany | 56103.7 | 48 |
| Sweden | 57117.5 | 29 |
| Australia | 64604.0 | 46 |
| Netherlands | 67520.4 | 31 |
| U.S. | 84534.0 | 77 |
And while most Americans think major changes to the political system are necessary, many don’t have much faith that these changes can happen. Around half of Americans (49%) could be referred to as pessimistic reformers – people who say the political system needs major changes but are not confident it can happen.
The other half of Americans are divided: 27% think the system needs major changes and are confident it can happen (optimistic reformers), while 23% think the system needs no changes or only minor ones (status quo supporters).
Related: People Around the World Want Political Reform but Many Doubt It Can Happen
Where are ‘pessimistic reformers’ common?

| Country | Pessimistic reformers: Political system needs change but not confident it can happen | Optimistic reformers: Political system needs change and are confident it can happen | Status quo supporters: Political system needs minor or no changes | Group |
|---|---|---|---|---|
| Greece | 68% | 15% | 17% | More pessimistic reformers |
| France | 57% | 17% | 25% | More pessimistic reformers |
| Spain | 55% | 18% | 26% | More pessimistic reformers |
| Italy | 54% | 14% | 31% | More pessimistic reformers |
| South Korea | 51% | 35% | 13% | More pessimistic reformers |
| U.S. | 49% | 27% | 23% | More pessimistic reformers |
| Japan | 48% | 15% | 35% | More pessimistic reformers |
| Turkey | 43% | 25% | 27% | More pessimistic reformers |
| Poland | 39% | 31% | 27% | More pessimistic reformers |
| Argentina | 32% | 45% | 22% | More optimistic reformers |
| South Africa | 23% | 52% | 24% | More optimistic reformers |
| Kenya | 20% | 59% | 19% | More optimistic reformers |
| Hungary | 18% | 47% | 34% | More optimistic reformers |
| Indonesia | 15% | 48% | 34% | More optimistic reformers |
| India | 10% | 59% | 25% | More optimistic reformers |
| Australia | 34% | 13% | 53% | More status quo supporters |
| Germany | 24% | 24% | 51% | More status quo supporters |
| Canada | 22% | 24% | 52% | More status quo supporters |
| Netherlands | 19% | 12% | 69% | More status quo supporters |
| Sweden | 16% | 13% | 71% | More status quo supporters |
| Nigeria | 43% | 47% | 8% | No clear majority or plurality |
| U.K. | 42% | 16% | 41% | No clear majority or plurality |
| Brazil | 40% | 46% | 12% | No clear majority or plurality |
| Mexico | 33% | 25% | 39% | No clear majority or plurality |
| Israel | 22% | 35% | 34% | No clear majority or plurality |
The U.S. is not the only country where pessimistic reformers make up the largest segment of the population. Across 25 countries we surveyed in 2025, the U.S. is among nine nations where this is the case. The others are Greece, France, Spain, Italy, South Korea, Japan, Turkey and Poland.
Where are ‘optimistic reformers’ common?
Like pessimistic reformers, optimistic reformers say the political system in their country needs major changes or complete reform. But unlike pessimistic reformers, they are confident that the system can be changed effectively.
In six of the countries we surveyed in 2025, optimistic reformers account for the largest share of the population: India, Kenya, South Africa, Indonesia, Hungary and Argentina.
Where are ‘status quo supporters’ common?
Not everyone feels their country’s political system needs major changes. Status quo supporters say their political system does not need to be changed or that only minor changes are needed.
Status quo supporters account for the largest share of adults in five surveyed countries: Sweden, the Netherlands, Australia, Canada and Germany.
How does the U.S. compare economically and politically with other ‘pessimistic reformer’ nations?
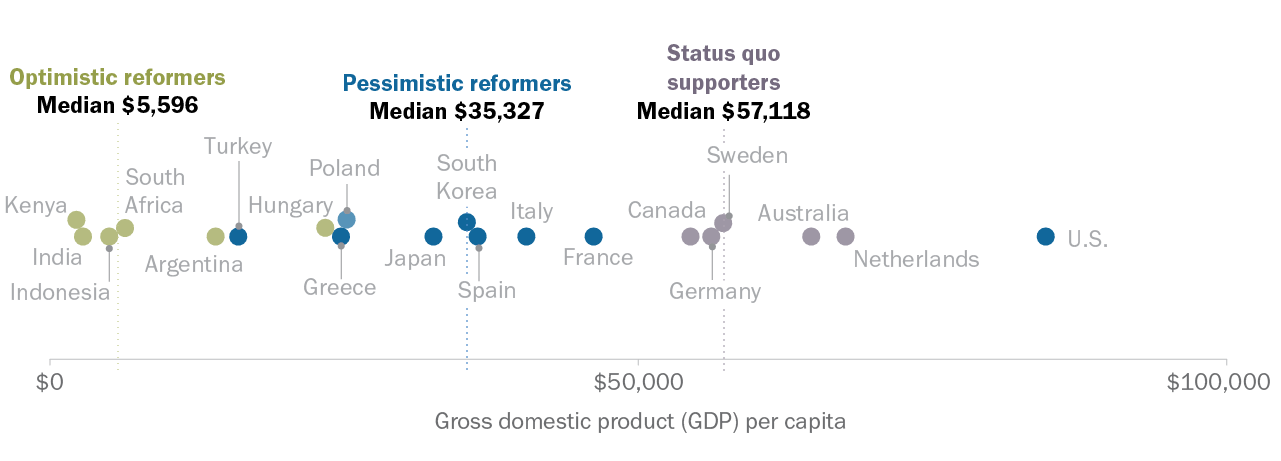
When it comes to gross domestic product (GDP) per capita, the U.S. stands out from other nations where pessimistic reformers are common. But in other ways, it is similar to those nations.
GDP per capita
The U.S. has by far the highest GDP per capita of the nine nations where pessimistic reformers account for the largest group in the country. By contrast, in the next five highest income nations we surveyed, status quo supporters tend to far outnumber pessimistic reformers. For example, in the Netherlands – which has the second-highest GDP per capita of the surveyed nations – 69% of adults are status quo supporters, while a far smaller share (19%) are pessimistic reformers.
| Country | Grouping | GDP per capita |
|---|---|---|
| Argentina | Optimistic reformers | 13,969.8 |
| Australia | Status quo supporters | 64,604.0 |
| Canada | Status quo supporters | 54,340.3 |
| France | Pessimistic reformers | 46,103.1 |
| Germany | Status quo supporters | 56,103.7 |
| Greece | Pessimistic reformers | 24,626.1 |
| Hungary | Optimistic reformers | 23,292.3 |
| India | Optimistic reformers | 2,694.7 |
| Indonesia | Optimistic reformers | 4,925.4 |
| Italy | Pessimistic reformers | 40,385.3 |
| Japan | Pessimistic reformers | 32,487.1 |
| Kenya | Optimistic reformers | 2,132.4 |
| Netherlands | Status quo supporters | 67,520.4 |
| Poland | Pessimistic reformers | 25,103.6 |
| South Africa | Optimistic reformers | 6,267.2 |
| South Korea | Pessimistic reformers | 36,238.6 |
| Spain | Pessimistic reformers | 35,326.8 |
| Sweden | Status quo supporters | 57,117.5 |
| Turkey | Pessimistic reformers | 15,892.7 |
| U.S. | Pessimistic reformers | 84,534.0 |
What is a median?
In this analysis, median scores are used to help readers see overall patterns in the data. The median percentage is the middle number in a list of all numbers sorted from highest to lowest. For example, the above graph shows that the median GDP per capita among the nine pessimistic reformer countries is $35,327.
GDP per capita tends to be lower in nations where optimistic reformers predominate.
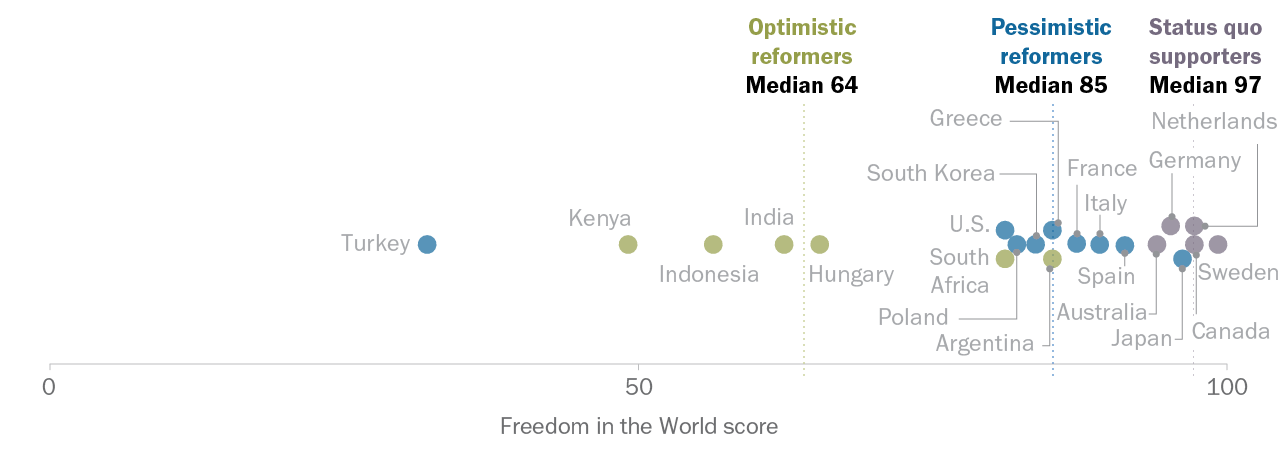
Democracy scores
Although it stands out on GDP per capita, the U.S. is similar to other pessimistic reformer nations when it comes to expert evaluations of the nation’s democracy. (This analysis relies on ratings from Freedom House. A higher score indicates that Freedom House rates a country as having more real-world rights and freedoms.)
| Country | Grouping | Freedom in the World score |
|---|---|---|
| Hungary | Optimistic reformers | 65 |
| India | Optimistic reformers | 62 |
| Indonesia | Optimistic reformers | 56 |
| Kenya | Optimistic reformers | 49 |
| South Africa | Optimistic reformers | 81 |
| Argentina | Optimistic reformers | 85 |
| U.S. | Pessimistic reformers | 81 |
| France | Pessimistic reformers | 89 |
| Greece | Pessimistic reformers | 85 |
| Italy | Pessimistic reformers | 87 |
| Poland | Pessimistic reformers | 82 |
| Spain | Pessimistic reformers | 91 |
| Japan | Pessimistic reformers | 96 |
| South Korea | Pessimistic reformers | 83 |
| Turkey | Pessimistic reformers | 32 |
| Canada | Status quo supporters | 97 |
| Germany | Status quo supporters | 95 |
| Netherlands | Status quo supporters | 97 |
| Sweden | Status quo supporters | 99 |
| Australia | Status quo supporters | 94 |
Related: Multiple indicators show a decline in the health of America’s democracy in 2025
Democracy ratings are generally high in the nine pessimistic reformer countries (although Turkey is a notable exception), but they are below those of countries with large shares of status quo supporters. For example, Sweden is the top-rated democracy of the countries surveyed, according to Freedom House. And 71% of Swedes say their country’s political system needs no changes or only minor ones.
Public views of their country’s fellow citizens and their nation’s economic future
People in pessimistic reformer countries are not just dissatisfied with their political system. They also tend to be less trusting of other people, view the morality of their fellow citizens more negatively and are somewhat more pessimistic about the economy than those in status quo supporter countries. The U.S. is generally aligned with other pessimistic reformer countries on each of these items.
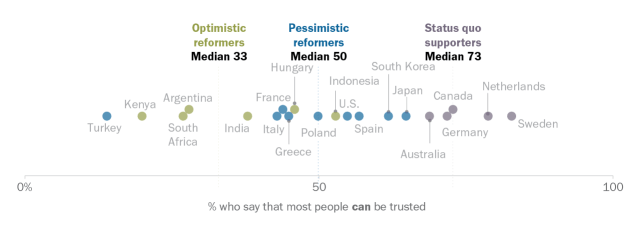
Social trust
Views of fellow citizens as morally good

| Country | Grouping | % who say that most people can be trusted | % who rate the morality and ethics of people in their country as good |
|---|---|---|---|
| Turkey | Pessimistic reformers | 14 | 51 |
| Kenya | Optimistic reformers | 20 | 72 |
| South Africa | Optimistic reformers | 27 | 63 |
| Argentina | Optimistic reformers | 28 | 70 |
| India | Optimistic reformers | 38 | 88 |
| Italy | Pessimistic reformers | 43 | 59 |
| France | Pessimistic reformers | 44 | 55 |
| Greece | Pessimistic reformers | 45 | 55 |
| Hungary | Optimistic reformers | 46 | 68 |
| Poland | Pessimistic reformers | 50 | 70 |
| Indonesia | Optimistic reformers | 53 | 92 |
| U.S. | Pessimistic reformers | 55 | 47 |
| Spain | Pessimistic reformers | 57 | 71 |
| South Korea | Pessimistic reformers | 62 | 78 |
| Japan | Pessimistic reformers | 65 | 83 |
| Australia | Status quo supporters | 69 | 85 |
| Germany | Status quo supporters | 72 | 72 |
| Canada | Status quo supporters | 73 | 92 |
| Netherlands | Status quo supporters | 79 | 80 |
| Sweden | Status quo supporters | 83 | 88 |
For example, 55% of Americans say most people can be trusted. That is substantially lower than the percentage in several countries where status quo supporters are most common. In Sweden and the Netherlands, for example, around eight-in-ten adults say most people can be trusted.
The U.S. also stands out as the only surveyed country where more adults describe the morality and ethics of other people in the country as bad than good.
In countries where status quo supporters are the largest group, most adults say that people in their country are morally good. For example, 92% of Canadians say this.
Related: In 25-Country Survey, Americans Especially Likely to View Fellow Citizens as Morally Bad
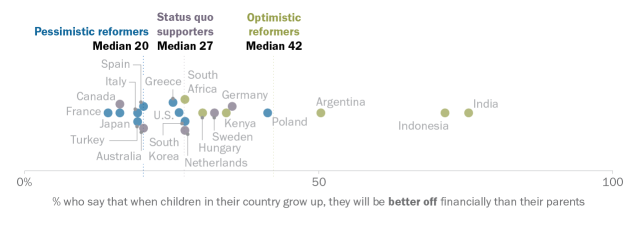
Pessimistic reformers also tend to be more negative about children’s economic future in their country. In the nine countries where pessimistic reformers are the largest group, a median of only 20% of adults said in a 2024 survey that children will be better off financially than their parents when they grow up. By contrast, people in countries where status quo supporters are the largest group tended to be slightly more optimistic on this measure.
People in optimistic reformer nations were generally more optimistic about the next generation’s financial prospects. A median of 42% thought children in their country will be better off. In India and Indonesia, seven-in-ten or more held this view.
| Country | Grouping | Percentage who say that when children in their country grow up, they will be better off financially than their parents |
|---|---|---|
| Hungary | Optimistic reformers | 30 |
| India | Optimistic reformers | 75 |
| Indonesia | Optimistic reformers | 71 |
| Kenya | Optimistic reformers | 34 |
| South Africa | Optimistic reformers | 27 |
| Argentina | Optimistic reformers | 50 |
| U.S. | Pessimistic reformers | 26 |
| France | Pessimistic reformers | 14 |
| Greece | Pessimistic reformers | 25 |
| Italy | Pessimistic reformers | 19 |
| Poland | Pessimistic reformers | 41 |
| Spain | Pessimistic reformers | 20 |
| Japan | Pessimistic reformers | 16 |
| South Korea | Pessimistic reformers | 27 |
| Turkey | Pessimistic reformers | 19 |
| Canada | Status quo supporters | 16 |
| Germany | Status quo supporters | 35 |
| Netherlands | Status quo supporters | 27 |
| Sweden | Status quo supporters | 32 |
| Australia | Status quo supporters | 20 |
Note: Here are the questions used for this analysis, along with responses, and the survey methodology.

