
As use of commercial voter lists by campaigns and public opinion researchers has grown, data offerings provided by voter file vendors have expanded. On top of standard political offerings, many vendors now provide a host of additional demographic and lifestyle data generated through predictive models or gathered from other sources. This chapter compares demographic data in the voter files with self-reports from panelists.
Predictive models leverage data from a mix of third-party commercial vendors and survey data to try to predict a number of characteristics, ranging from a person’s race to educational attainment. However, for some modeled variables, much of the underlying information is available only in a portion of states. For example, vendors rely on a mix of information from voter records and additional data to predict an individual’s race or ethnicity. In 16 states or portions of states, largely in the South, the Voting Rights Act of 1965 mandated that states list voters’ race on the state voter rolls. However, in states where this information is not available, vendors attempt to use information from other sources such as identifying common surnames or if someone lives in an area that is densely populated by a particular race.
In addition to state voter records and commercial data, some voter file vendors use survey data to enhance and build their models. Partisan vendors, in particular, often feed survey data from partner organizations into the models to improve their accuracy.
Race and ethnicity are generally well measured in the files
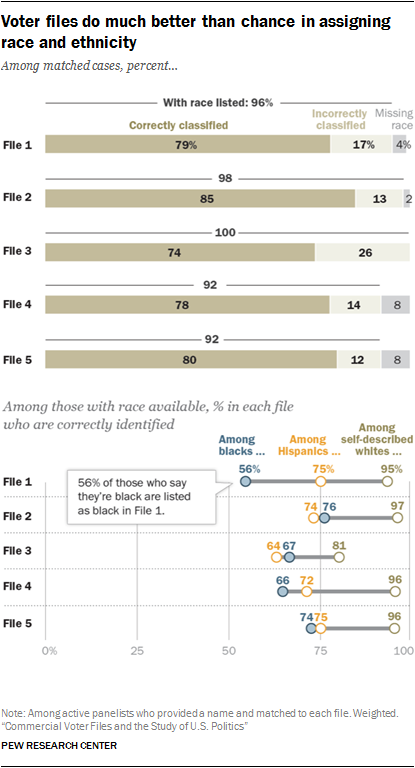
Given the central importance of race and ethnicity in American politics, voter file vendors attempt to identify the race of the individuals in the file. Vendors may use race as recorded on state voter records in places where the states are required to collect it. In other locations, race may be modeled using information like surname or geographic concentration.
The modeled race and ethnicity of panelists was compared with how panelists described it when they were recruited to the panel (or in subsequent profile surveys). Overall, most vendors are able to accurately identify the race of white respondents, with rates of correct identification varying between 81% for File 3 to 97% for File 2. However, when it comes to accurately identifying the race of self-reported black and Hispanic panelists, some vendors are more accurate than others.
Among panelists who self-report being black in a survey measure, roughly three-quarters in Files 2 and 5 (74% in File 5 and 76% in File 2) are correctly classified as black by the respective models. However, the model in File 1 identifies far fewer black panelists accurately (56%).
In classifying self-reported Hispanic panelists, there is less of a difference across the files, ranging from a low of 64% of Hispanics correctly classified in File 3 to 75% in Files 1 and 5.
Overall, the rate of correct classification by race ranges from 74% for File 3 to 85% for File 2.
Other demographic variables vary greatly in accuracy
In addition to information provided by state voter rolls, many voter file vendors include information from other public and commercial data sources. This data could originate from a variety of sources, such as from magazine subscriptions or credit bureaus, with the goal of providing additional information about Americans beyond what is available directly from state voter lists.
The presence of commercial data in voter files is widespread; however, the specific variables available differ by vendor. Many vendors possess financial data from credit bureaus or credit card companies, including things like home price and mortgage amount. In addition, some vendors provide information like occupation, income and the number of adults or children in a household. The presence of hunting or fishing licenses is one of the most ubiquitous commercial variables.
This commercial data also presents itself in several ways. Some of these variables stand alone as flags, such as the presence of a hunting license, while others are included in models to predict particular outcomes or demographics. For example, several vendors provide models for personal interests like being a gun owner or a boating enthusiast – information that is modeled based on sources such as magazine subscriptions.
An analysis of three of the more commonly available commercial variables – education, income and religious affiliation – shows that some models are more accurate than others. Overall, most vendors had a higher rate of accuracy in predicting education than income. When it comes to religious affiliation, vendors for the most part correctly predict large religions in the U.S. such as Protestantism but have less success with lower incidence religions like Buddhism.
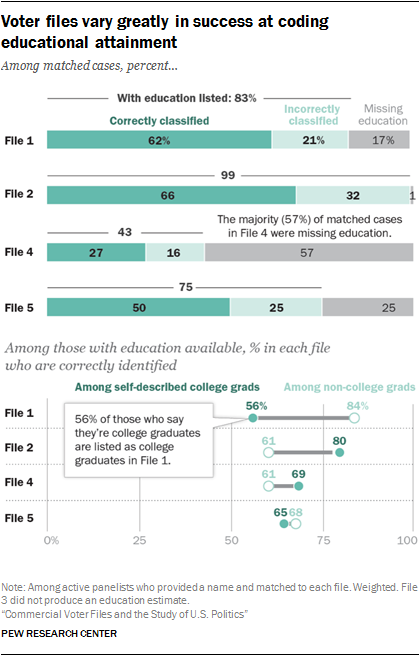
One common issue across many of the models is the preponderance of missing data, with large portions of matches listed as unclassified on some variables. For example, in assessing models produced to predict educational attainment, more than half (57%) of matches in File 4 and one-quarter (25%) of matches to File 5 are listed as unclassified.
However, when those missing an estimate for education are excluded, many of the models have a reasonably high rate of correctly classifying panelists with their self-reported education status. Fully six-in-ten or more college graduates are correctly classified as having graduated in college in Files 1, 4 and 5.12

Household income may be the most difficult of the demographic variables to assess. The accuracy of survey measurements of income can be affected by many factors, including a respondent’s lack of knowledge (respondents are typically asked to recall total household income from a previous year). Additionally, income is a sensitive topic, and survey respondents are more likely to decline to provide their income than with other demographic variables. It is perhaps unsurprising that modeled income in the files – even where provided – does not match survey reports of income very closely. Overall, the four files that provided an estimated income corrected placed only 30% to 46% respondents into one of four categories.
The files had trouble classifying both high- and low-income respondents. Four-in-ten or more who self-report having an income of $100,000 or more are correctly classified by File 4 (41% correctly classified) and File 5 (45%). And roughly one-third of the self-reported lowest-income adults (under $30,000 annually) are correctly classified by each of the four files that reported income.
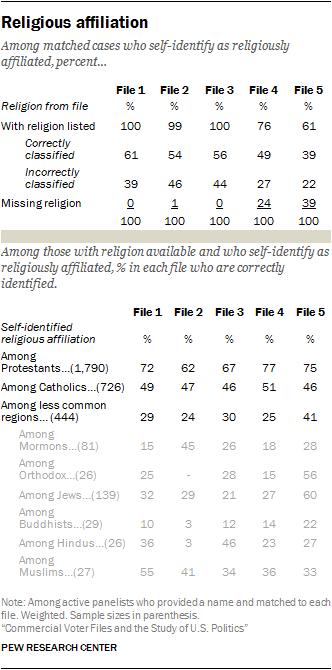
Models used to predict religious affiliation vary considerably in the rates of correctly classified panelists. To be sure, all models do best at accurately predicting Protestants, the largest religious group in the United States. In Files 1, 4 and 5, about three-quarters (72%, 77% and 75% respectively) of self-identified Protestants are correctly classified. File 2 correctly classifies roughly six-in-ten (62%) of Protestants. (As a baseline, slightly less than half of Americans currently identify as Protestant.)
Within the smaller religious groups in the U.S., some are more likely to be correctly modeled than others. For example, most of the files do a better job of correctly classifying Hindus than of classifying Buddhists, even though both groups are roughly equally rare in the U.S.
The files do not attempt to categorize people who are unaffiliated with a religion, but their residual category of “unclassified” provides evidence that some individuals are not religiously identified. Overall, the unclassified group varies from 5% to 21% across the files. But these unclassified individuals are not necessarily the religiously unaffiliated – just 28% of those who are unclassified in File 1 are people who identify in the panel as atheist, agnostic or “nothing in particular,” and this rises to 36% among those File 2. Given that nearly one-quarter of adults are religiously unaffiliated, the residual category of “uncategorized” does not do a particularly good job of finding them.
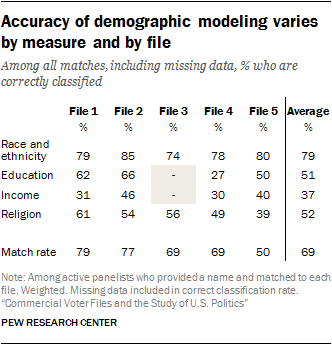
The total percent who are correctly classified, including those who are missing or unclassified for a given variable, provides a comparison among various modeled demographics. Many of the files were able to correctly classify a high share of panelists to their self-reported religion. Still, several files stood out, particularly the file with the lowest match rate (File 5), for being able to correctly classify sizeable shares of respondents’ education and income.


