
The items used in the so-called Perry-Gallup scale – originally developed in the 1950s and ’60s by election polling pioneer Paul Perry of Gallup and used in various combinations and with some alterations by the Pew Research Center, Gallup and other organizations in their pre-election polling (Perry 1960, 1979) – are widely employed by survey researchers in part or whole. This appendix presents data on how well each item discriminated between voters and nonvoters in 2014.
Measures of vote intention
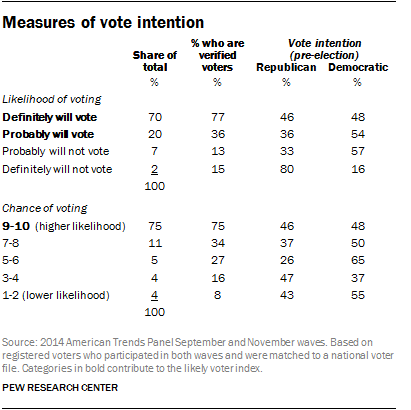
The most direct way of predicting voter turnout is to simply ask whether a person intends to vote or not. And, in fact, this is the likely voter method that many pollsters use: Those respondents who say they will vote are included in the survey; those who say they won’t vote are not. There are a variety of different ways of asking the “do you plan to vote” item. Since the vast majority of registered voters (90% or more) say they plan to vote, many researchers ask a follow-up question to gauge certainty of voting among those who plan to vote.
In the American Trends Panel, we asked a slightly different question about the respondent’s likelihood of voting: 70% of registered voters told us they “definitely” would be voting in the 2014 election. More than three-quarters (77%) of this group were verified as having voted, compared with only 36% among those who said they were “probably” going to vote. The “probably will vote” group also has a skewed partisan makeup (36% Republican, 54% Democrat) compared with those who said they would definitely be voting (46% Republican, 48% Democrat).
A different way to get at a similar concept is by asking respondents to rate their likelihood to vote on a 1 to 10 scale. Fully 75% of respondents rate the likelihood as a 9 or 10, giving them a point on the scale. A 75% majority of those voters are verified as having voted. By comparison, only one-third (34%) of those rating a 7 or 8 were verified as having voted.
Both of these measures do a good job of identifying nonvoters. Most of those who say they won’t vote, or that there is a low likelihood that they will vote, in fact do not turn out. But the challenge in surveys is that relatively few registered voters say they won’t vote.
Measures of voter engagement
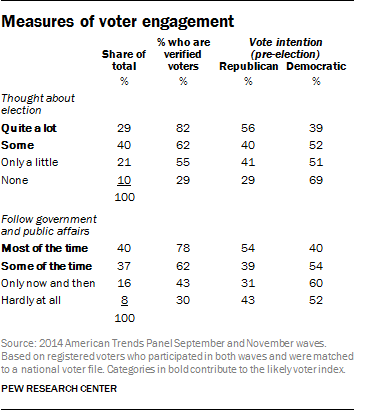
Citizens who are more interested in politics and who have been paying attention to the campaign are presumably more likely to vote than those who a re less interested. To measure engagement in the election, respondents were asked how much they had thought about the upcoming election. Fully 69% of respondents said they thought “quite a lot” or “so me” about the upcoming election. To measure general interest in politics, respondents were asked how often they follow government and public affairs; 77% of respondents said they follow government affairs “most of the time” or “some of the time.”
These questions are weaker at discriminating between voters and nonvoters than are the measures of vote intention. The Perry-Gallup scale assigns a point to respondents who say they have thought “quite a lot” or “some” about the election, but 55% of those who said they had thought “only a little” about the election also voted – and this group was one-fifth of the sample (21%). In addition, a substantial 43% turned out among those who said they follow government and public affairs “only now and then.”
Measures of past voting behavior
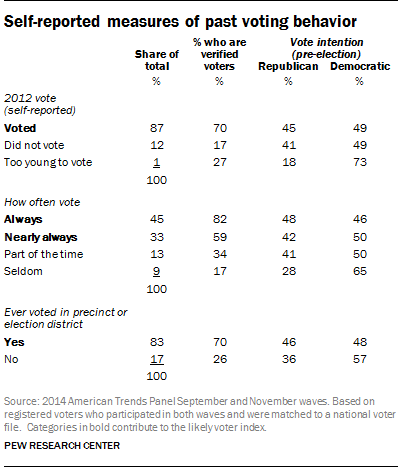
Measures of past voting behavior are central to any gauge of the likelihood of voting. The Perry-Gallup index uses three measures of past voting: whether an individual voted in the previous presidential election, the individual’s own assessment of how regularly he or she votes, and whether he or she has ever voted in their local precinct or election district. (Since respondents ages 18-21 may not have had the opportunity to vote in previous national elections, they typically are given an additional 1-point boost on the scale to compensate.)
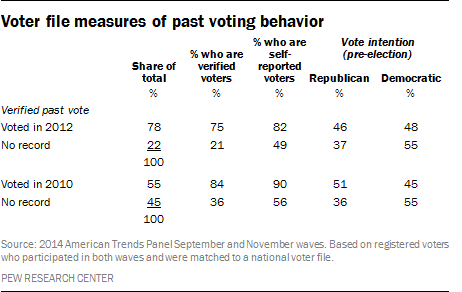
Past vote has been shown to be a strong predictor of future behavior. According to the voter file, respondents who said they voted in the 2012 presidential election were more than four times as likely as those who did not vote to have voted in 2014. While some voters who say they did not vote in 2012 still turned out in 2014 (17% were verified as voters), an analysis of respondents matched to the voter file shows that only 5% have a record of voting in 2014 but not 2012.
Not surprisingly, self-reported regularity of voting also discriminates between voters and nonvoters. Fully 78% of respondents say they always or nearly always vote in elections, and 82% of those who say they “always” vote were verified as 2014 voters, as were 59% among those who said they “nearly always” vote. That number drops significantly for those who say they vote “part of the time” and those who say they “seldom” vote – only 34% and 17%, respectively, had a verified voting record for 2014.
Measure of past voting also implicitly captures knowledge of how and where to vote. One standard question in the likely voter index asks about previous voting in the respondent’s precinct or election district, and another asks about knowledge of where to vote. (This question may become increasingly irrelevant in an era of early voting and “just in time” information on smartphones.) In midterm elections, only a question about past voting in one’s precinct is typically included. Fully 83% of respondents say they had voted in their precinct in the past, and 70% of these are verified as 2014 voters. Among those who said they hadn’t voted in their local election venue, just 26% were verified voters in 2014.
Voter file records
Pollsters who draw their election samples from databases of registered voters – or those who are able to match their RDD respondents with the national voter file – have an additional source of information about past voting behavior: a verified record of voting in past elections. Voting history can also be used in a likely voter prediction model in the same way as the respondents’ self-reports of past voting.
As described earlier, 89% of the self-reported registered voters in the panel who completed both the pre-election and post-election waves were matched to a voter file that contains records of past voting dating back several election cycles.
More details about Pew Research Center’s methodology for estimating likelihood to vote are available at https://assets.pewresearch.org/wp-content/uploads/sites/5/2011/01/UnderstandingLikelyVoters.pdf.


