
Survey Report
After a sweeping midterm election victory on Nov. 4, the Republican Party retook full control of Congress. But the public has mixed reactions to the GOP’s big win – much as it did four years ago, after Republicans gained control of the House though not the Senate.
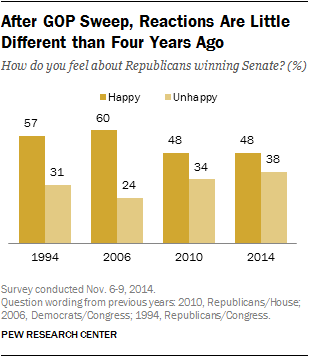
The post-election survey by the Pew Research Center finds that about half of Americans (48%) are happy the Republican Party won control of the Senate, while 38% are unhappy. That is almost a carbon copy of the public’s reactions to the 2010 election: 48% were happy the GOP won control of the House, while 34% were unhappy. There was much greater public enthusiasm after the Democrats gained control of Congress in 2006, and after the GOP swept to victory in both the House and Senate in the 1994 midterm election.
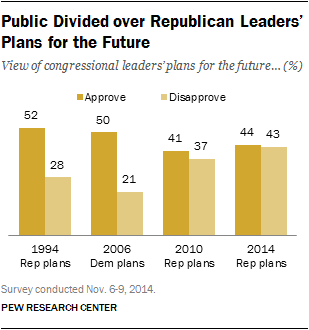
As was the case four years ago, the public is divided over GOP leaders’ policy plans. About as many approve (44%) as disapprove (43%) of Republican congressional leaders’ policies and plans for the future. Following the 2010 election, 41% approved and 37% disapproved of Republican leaders’ plans. The public by wide margins approved of Democratic leaders’ future plans and policies in 2006 (50% to 21%) and Republican leaders’ proposals in 1994 (52% to 28%).
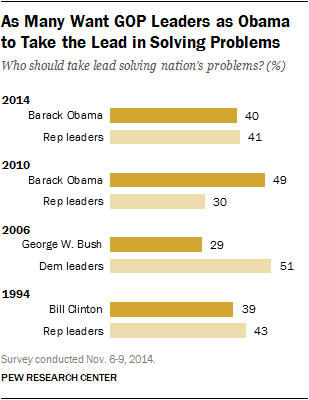
The new national survey by the Pew Research Center, conducted Nov. 6-9 among 1,353 adults, finds divided opinions over who should take the lead in solving the nation’s problems – 41% say Republican congressional leaders, while 40% say Barack Obama.

That represents a shift from four years ago, when far more wanted Obama than Republican leaders to take the lead (49% to 30%). It also is a sharp contrast with the public’s views after the 2006 election – ahead of President George W. Bush’s final two years in office – when by 51% to 29%, more preferred Democratic leaders than President Bush to take the lead in solving the nation’s problems.
While victorious Republicans do not engender a great deal of public confidence, neither does President Obama. His overall job rating is virtually unchanged since just prior to the election: 43% approve of his job performance while 52% disapprove.
Obama’s job rating is higher than Bush’s was following the 2006 midterm election (43% vs. 32%), but there is as much skepticism about Obama’s ability to get things done over the remainder of his term as there was about Bush’s in 2006. Just 6% think Obama will accomplish a great deal of what he would like to do in the remaining two years of his presidency, while 33% say he will accomplish some of it. Most (59%) say he will be able to accomplish not much or nothing of what he wants to get done. After the 2006 midterm election, 57% thought Bush would get little or nothing done.
On several specific issues, more prefer the approach offered by congressional Republicans than President Obama, although a sizable share sees little difference between the two sides. On jobs and economic growth, for instance, 35% say Republicans in Congress have a better approach compared with 29% who say Obama’s approach is better; but nearly a third (32%) think there will not be much difference. Across nine issues tested, Obama has a clear advantage over congressional Republicans on only one: 35% say he has the better approach on the environment, while just 20% prefer the Republican approach; 41% think there is not much difference between the two.
Other Important Findings
A Negative Campaign, But Not Like 2010. Most voters (62%) say there was more “mud-slinging” or negative campaigning in this year’s midterm than in past campaigns. But following the bitter election four years ago, 77% of voters described the election as more negative than previous elections.
Will the Election Change Things? About one-in-five Americans (21%) say Republican control of the Senate will change the way things are going in this country “a lot” and 37% say it will change things “some.” Nearly four-in-ten (38%) expect little or no change as a result of the election. Republicans are about twice as likely as Democrats to think that the GOP winning the Senate will usher in major changes (32% vs. 18%).
ACA Opponents Divided over Repeal. Views of the 2010 health care law remain little changed: 45% approve of the law while 51% disapprove. Those who disapprove of the law are evenly split over whether Republican leaders should focus their efforts on modifying the law or on “getting rid of the law entirely.”
Keystone Politically Contentious. A majority of Americans (59%) favor building the Keystone XL pipeline; that is little changed from March of this year (61%), but down seven points from March 2013. Currently, 83% of Republicans favor building the pipeline, virtually unchanged from March 2013, but Democratic support has fallen 11 points since then, from 54% to 43%.
What’s Ahead? Just 18% Expect Partisan Relations to Improve
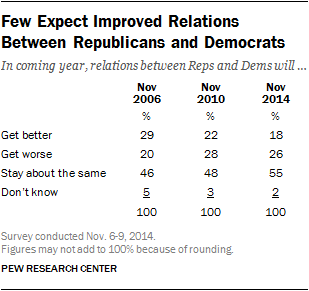
The public is not optimistic that the new balance of power in Washington will improve relations between Republicans and Democrats. Overall, just 18% say they think relations between Republicans and Democrats will get better in the coming year, while 26% expect them to get worse; most (55%) expect them to stay about the same.
This public’s outlook is little different than it was following the 2010 midterm elections. In November 2006, views were slightly more positive: at that time, 29% thought relations between Republicans and Democrats would improve in the next year, compared with 20% who thought they would get worse; 46% expected them to stay about the same.
In the current survey, Republicans are as likely to expect party relations to get better as worse (24% each), while 51% think they will stay the same. Democrats (28%-15%) and independents (25%-16%) are more likely to expect things to get worse than better, though majorities of both groups expect little change (55% of Democrats, 58% of independents).
Partisan Divisions in Willingness to Compromise
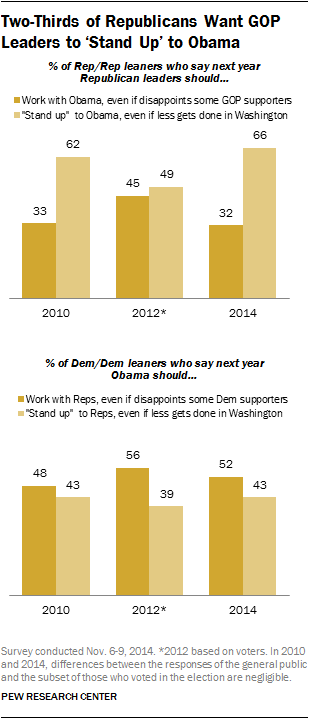
A majority of Americans would like to see Barack Obama and Republican leaders work together over the coming year. But Republicans are far more likely than Democrats to favor a confrontational approach toward the political opposition, even if that results in less getting done.
Overall, 57% of the public says Republican leaders in Washington should try as best they can to work with Barack Obama to accomplish things, even if it means disappointing some groups of Republican supporters, while 40% say they should “stand up” to Obama on issues that are important to Republican supporters, even if it means less gets done in Washington. And by about a two-to-one margin (62% to 30%) more say Obama should work with Republicans than say he should stand up to the GOP.
These opinions are little changed from 2010. Following the 2012 presidential election, there was greater support for compromise: 67% of voters in that election said GOP leaders should try to work with Obama, and 72% said Obama should work with them.
Within the Republican Party, only about a third of Republicans and Republican leaners (32%) want to see the GOP leadership work with Obama if it disappoints some groups of Republican supporters. About twice as many (66%) say GOP leaders should stand up to Obama even if less gets done. This reflects a shift away from wanting to see their leadership work with Obama in the wake of his reelection two years ago, but is little different than opinions among Republicans after the party’s 2010 midterm victory.
In contrast, about half (52%) of Democrats and Democratic leaning independents say Obama should try as best he can to work with Republican leadership even if it results in some disappointment among Democrats, while 43% say he should stand up on issues important to Democrats at the risk of less productivity in Washington.
Views of Parties’ Ideological Directions
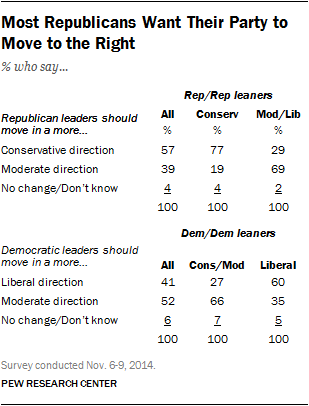
By a 57% to 39% margin, more Republicans and Republican leaning independents say their party’s leadership should move in a more conservative, rather than more moderate, direction. These views are little changed over the last four years.
And, as in the past, Democrats are more likely to say their party leadership should move in a more moderate direction (52% say this) than a liberal direction (41%). Yet the share saying the party should move in a liberal direction is now higher than it was following the 2010 midterms (41% today, up from 34%).
To some extent these differences between the two parties are the result of compositional differences: While 58% of Republicans and Republican leaners identify as conservative, only about four-in-ten Democrats and Democratic leaners (42%) identify as liberal.
Additionally, while about three-quarters (77%) of conservative Republicans and GOP leaners say they’d like to see the party become more conservative, a smaller majority (60%) of liberal Democrats and Democratic leaners say their party should shift to the left. Still, the share of liberal Democrats and Democratic leaning independents who want to see their party move in a more liberal direction has slightly increased from four years ago, from 50% to 60%.
Expectations for Congressional Republicans
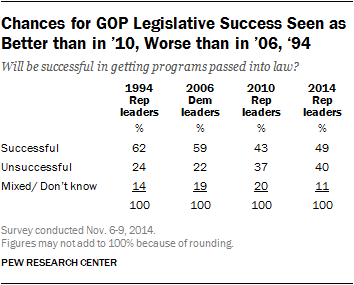
About half of Americans (49%) expect that Republican leaders will be successful in getting their programs passed into law, while 40% say they will be unsuccessful. This is a more positive outlook for the GOP than after the 2010 election (43% successful). But in 2006, 59% thought the Democratic leaders would achieve legislative success, and 62% said the same about the victorious Republican leaders in December 1994.
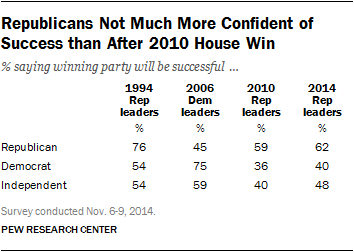
Republicans themselves are not much more confident of their party’s chances for success than they were four years ago when they held the House but not the Senate. Currently, 62% of Republicans say GOP leaders will be successful in passing programs into law, little changed from November 2010.
After gaining full control of Congress in 2006, 75% of Democrats thought their party’s leaders would achieve legislative success, and 76% of Republicans said their leaders would be successful after their victories in the 1994 election.
Concerns about Excessive Investigations
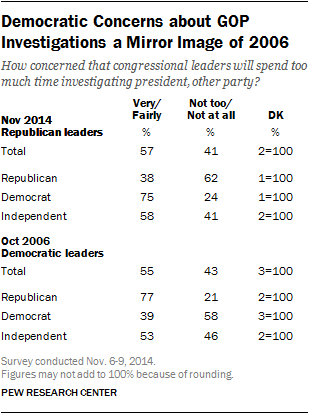
In addition to not expecting Republican majorities in Congress to improve Washington’s political climate, many express concern over how the GOP may apply its newly-won power. Overall, 57% say they are either very (27%) or fairly (30%) concerned that Republicans controlling Congress will lead to them spending too much time investigating the Obama administration and Democrats in Congress; 26% are not too concerned about this and 15% are not at all concerned.
Three-quarters of Democrats (75%) and 58% of independents are concerned Republicans will go too far investigating political opponents. Among Republicans, about four-in-ten (38%) express at least some concern over this, while most (62%) say they are not too or not at all concerned that Congressional Republicans will spend too much time investigating Obama and Congressional Democrats.
Concerns about partisan investigations following a change in the balance of power in Congress are not new. In October 2006, 55% said they would be concerned about Democrats spending too much time investigating the Bush administration and Republicans, if they were to take control of Congress in that November’s midterm elections.
GOP Favored on Several Issues
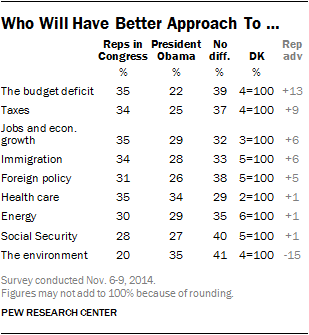
On several issues, the public favors congressional Republicans’ approach over President Obama’s. But substantial shares say there is no difference between the two approaches across a number of topics.
Republicans have advantages when it comes to the budget deficit (+13), taxes (+9), jobs and economic growth (+6), immigration (+6) and foreign policy (+5). Views are split on health care, energy and Social Security, while the environment is the one issue on which Obama has an advantage (+15).

After the 2010 midterms, the divides were almost identical; for example, the public preferred congressional Republicans’ approach to the deficit by 11 points and taxes by 12 points. But these differences are smaller than after the 1994 election, when an NBC/Wall Street Journal survey found an overwhelming preference on many issues for the Republicans’ approach instead of Bill Clinton’s.
On immigration policy, about one-in-three (34%) say congressional Republicans will have the better approach, while 28% prefer Obama’s approach and 33% say there won’t be much difference.
Nearly two-thirds of Republicans (65%) say the GOP will have a better approach, including 72% of conservative Republicans. About half of moderate and liberal Republicans (51%) agree, but 37% say there won’t be much difference. Liberal Democrats are more likely than conservative and moderate Democrats to side with Obama on his immigration approach (61% vs. 46%).
By a three-to-one margin, Hispanics think Obama will have the better approach to immigration policy (36% vs. 12% for Republicans), but roughly half (47%) say there won’t be much difference. Non-Hispanic whites, on the other hand, choose congressional Republicans, 42% to 24%.
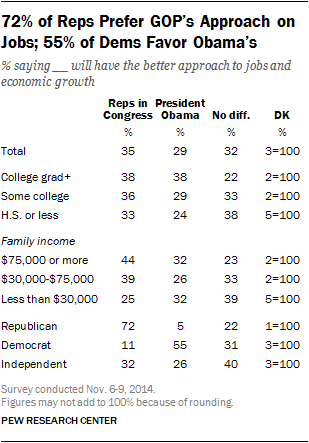
When it comes to approaching jobs and economic growth, the public also places more confidence in Republicans in Congress over Obama (35% to 29%, with 32% saying no difference). Within the GOP, fully 72% think congressional Republicans have the best approach, while a smaller majority of Democrats (55%) say the same about Obama.
Obama fares the best on jobs and the economy among college graduates. Equal shares prefer his approach and that of congressional Republicans (38% each). Among adults with less education, more think that Republicans have the better approach.
Those in middle- and upper-income households are more likely to favor Republicans than Obama on this issue. Among those with family incomes of less than $30,000, just one-in-four (25%) think the Republicans have the best approach, while nearly one-in-three (32%) favor the Democrats and 39% think there is no difference.
Policy Views: Keystone, Fracking, Limits on Power Plant Emissions
Among the goals of the new GOP majority in Congress is passing legislation to approve construction of the Keystone XL pipeline, which would transport oil from Canada’s oil sands region through the Midwest to refineries in Texas. By nearly two-to-one, the public favors building the pipeline (59% to 31%); yet overall support is down from March 2013 when 66% favored the project.
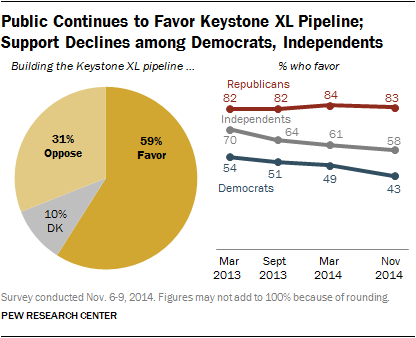
While support among Republicans has held firm in the last year and half, it has declined among both Democrats and independents.
Currently, 83% of Republicans favor building the pipeline, compared with 58% of independents and fewer
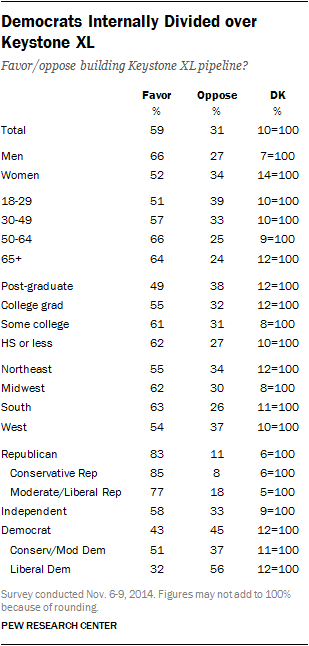
than half of Democrats (43%).
Since March 2013, support among independents is down 12 points (70% to 58%), and down 11 points among Democrats (54% to 43%). Republicans’ views of the pipeline project are virtually unchanged (82% then, 83% now).
While Democratic support for building the pipeline has fallen, Democrats remain internally divided over its construction. Currently, 51% of conservative and moderate Democrats support the project compared with just 32% of liberal Democrats.
By contrast, there continues to be only slight differences in opinions about whether to build the pipeline between conservative Republicans (85% favor) and moderate and liberal Republicans (77% favor).
Aside from political divisions, support for the pipeline also varies across demographic groups. Two-thirds of Americans age 50 or older support the pipeline, compared with about half (51%) of those under 30 years of age. By educational experience, about six-in-ten of those without college degrees favor Keystone, while only 49% of those with post-graduate education support the project.
Geographically, in all four regions of the country majorities support advancing Keystone. For example, in the Midwest, where the pipeline would be built connecting Canada’s oil sands with refineries in Texas, 62% favor constructing the pipeline, just 30% oppose.
Views on Increased Use of Fracking Tilt Negative

Support for the increased use of fracking to extract oil and natural gas from underground rock formations has declined since last year. Overall, 41% favor the increased use of fracking while 47% are opposed. In March 2013, there was more support (48%) than opposition (38%) to the drilling technique.
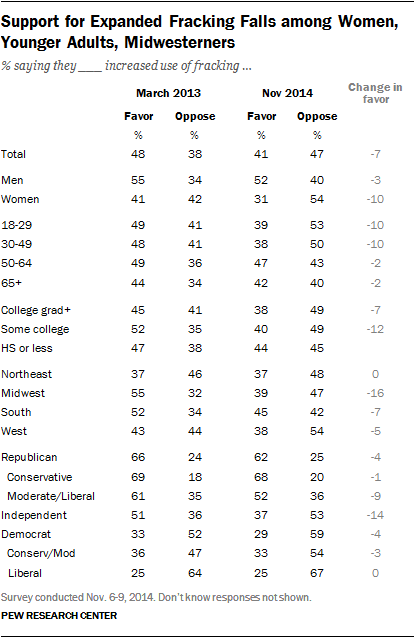
Opposition to increased fracking has grown among a number of demographic groups. Women now oppose the increased use of fracking by a wide margin (54% to 31%). In March 2013 women were divided, with 41% favoring expanded use of the practice and 42% opposed. Support for increased fracking has fallen 10 points among younger adults (those under 50) since then, from 48% to 38%, while holding steady among older Americans (currently 45%).
There has been a particularly dramatic change in views of fracking among those in the Midwest. In March 2013, 55% of Midwesterners favored expanded fracking while 32% were opposed. Today, 47% oppose more fracking while 39% support it.
The partisan gap over increased fracking remains substantial: 62% of Republicans back the increased use of this process compared with 29% of Democrats. Independents now oppose expanded fracking, 53% to 37%. In March 2013, more independents favored (51%) than opposed (36%) the increased use of fracking.
Broad Support for Stricter Emissions Limits
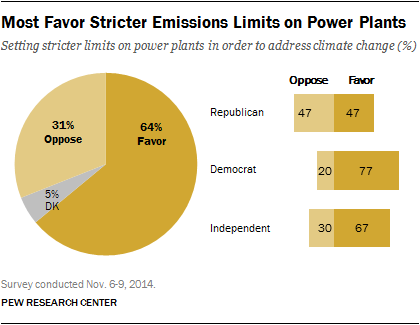
About two-thirds (64%) of the American public favors stricter limits on power plant emissions to mitigate climate change, while a 31% minority oppose stricter limits on emissions.
As with Keystone and fracking policies, views on regulating emissions are divided along partisan lines. Democrats are far more supportive than Republicans of stricter emission limits on power plants to address climate change. Nearly eight-in-ten Democrats (77%) favor these measures compared with 67% of independents. Among Republicans, as many say they oppose as say they favor these efforts (47% each).
Policy Views: Republicans Spilt Over Repealing ACA
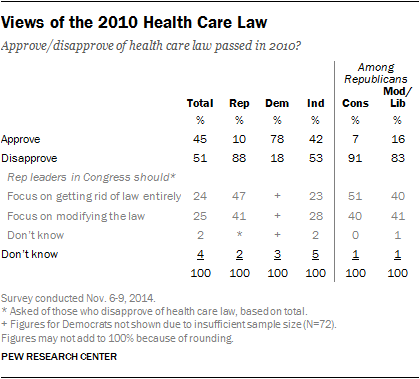
More than four years after it was passed by a Democratic-controlled Congress, the Affordable Care Act remains unpopular with the public. Overall, 51% disapprove of the health care law while 45% approve; views of the law are little changed over the past year.
Republicans remain deeply opposed to the health care law: 88% say they disapprove of the ACA, while just 10% approve. Independents also disapprove of the law by a 53%-42% margin. Most Democrats, by contrast, express support (78% approve, 18% disapprove).
There is no consensus among those who disapprove of the law about how the new GOP-controlled Congress should deal with it going forward. Among the 51% who disapprove of the health care law, about as many say Republican leaders in Congress should focus on getting rid of the law entirely (24% of the public) as say they should focus on making modifications to the law (25% of the public).
Among Republicans, 47% disapprove of the law and want their congressional leaders to focus on repealing it, while almost as many (41%) disapprove of the law and say they want leaders to focus on modifying the existing law.
Differences within the GOP along ideological lines are relatively modest. Conservative Republicans are only somewhat more supportive of repeal (51%-40%) than are moderate and liberal Republicans (40%-41%).
Views of Campaign ’14: More Saw Reduced Focus on Issues
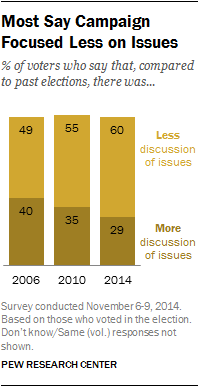
Voters report less discussion of issues during the 2014 campaign than in recent midterm elections. Six-in-ten (60%) say that there was less discussion of issues this year compared to past elections; about three-in-ten (29%) say that there was more discussion of issues than past years. This is the lowest percentage saying there was more discussion of issues than in any election since the 1998 midterm.
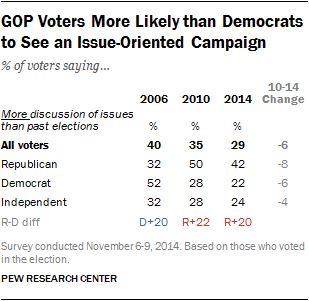
As is often the case, members of the winning party – in this case, Republicans — have more positive views of the campaign. Nearly twice as many Republican as Democratic voters say there was more discussion of issues than in past elections (42% vs. 22%). In 2006, opinions were reversed: about half of Democratic voters (52%) said there had been more discussion of issues compared with just 32% of Republicans.
Similarly, in both of Obama’s election victories, more Democrats than Republicans said the election had been more focused on issues. The gap was particularly striking in 2008: 76% of Democratic voters said there had been more discussion of issues than in prior campaigns, while 40% of Republican voters agreed.
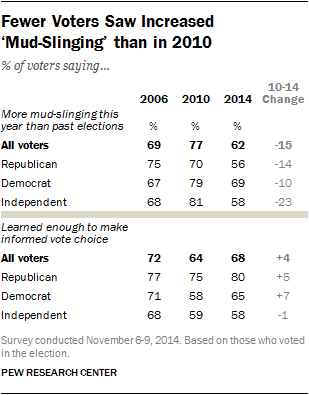
As voters look back on the campaign, most say the tone was negative. In fact, 62% say there was more “mud-slinging” or negative campaigning than in past elections. But that was down 15 points from 2010, when 77% said there had been more negative campaigning.
In most recent elections, including presidential elections, majorities said the campaign had been more negative than prior elections. After the 2012 election, 68% expressed that view, but fewer (54%) did so after Obama was first elected.
More Democratic voters (69%) than Republican voters (56%) say this year’s election was more negative than past elections.
About two-thirds of voters (68%) say they learned enough about the candidates and issues to make an informed choice, little different than in 2010. Though majorities of Republican, Democratic and independent voters say they learned enough, fully 80% of Republicans say this, compared to smaller majorities of Democrats (65%) and independents (58%)
Voters Confident Their Votes Were Counted Accurately
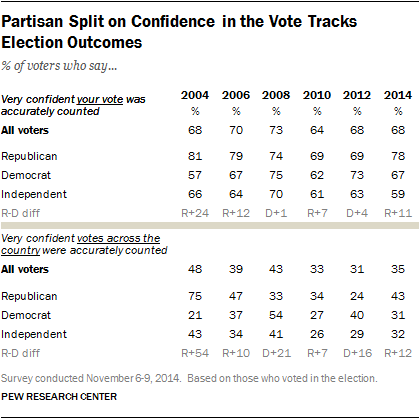
As in past elections, most voters have a great deal of confidence that their own vote was counted accurately this year, but they are less confident that votes nationwide were counted accurately.
Nearly seven-in-ten voters (68%) say they are very confident that their vote was counted accurately, while just 35% say the same about votes across the country. Nonetheless, most voters are at least somewhat confident about the vote count nationally: 77% say they are very or somewhat confident votes across the country were counted accurately while 20% are not too confident or not at all confident in the accuracy of the vote count.
Republican voters express more confidence in this year’s voting process than Democrats and independents: 43% of Republican voters say they are very confident votes across the country were accurately counted, compared with about three-in-ten Democratic (31%) and independent (32%) voters. GOP voters are also more likely to say they are confident their own votes were counted correctly.
Early Voting On the Rise
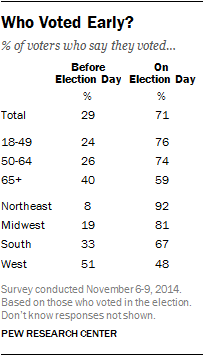
The share voting before Election Day has increased in recent years: 29% of voters say they cast their ballot prior to Election Day this year, up from 20% in 2006 and 15% in 2002. Still, early voting is more prevalent in years when there is a presidential election: In 2012, fully 37% of voters said they voted prior to Election Day.
Voters ages 65 and older continue to be more likely than others to vote before Election Day: 40% say they did so, compared with about one-in-four of those under 65.
Early voting was most prevalent in the West, a region that includes the only three states (Colorado, Oregon and Washington) that conduct all of their elections by mail. About half (51%) of western voters reported casting their ballots early, compared with 33% of southern voters and just 19% of voters in the Midwest and 8% in the Northeast.
Among those who voted in person (either early or on Election Day), most (77%) did not have to wait to cast their ballot. Just 23% of in-person voters waited in line, with just 3% saying they waited 30 minutes or more to vote.
Why Some Didn’t Vote
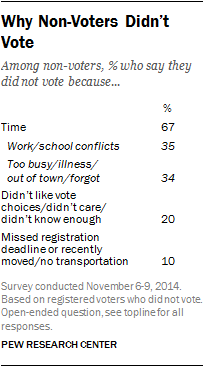
Voter turnout is consistently lower in midterm elections than in presidential contests. But turnout was especially low in 2014 – preliminary estimates indicate fewer than 40% of those eligible to vote actually cast ballots, either by mail or in person.
Among those who were registered to vote but chose not to, two-thirds (67%) gave reasons related to lack of time: 35% had work or school conflicts and 34% were too busy, ill, out of town or simply forgot. Two-in-ten (20%) registered non-voters say they either didn’t like the candidate choices or issues on the ballot, didn’t care about this election or didn’t have any or enough information to vote. And 10% of non-voters reported having a technical reason for not voting, either having missed the registration deadline, recently moving, or not have transportation to the polls.


