
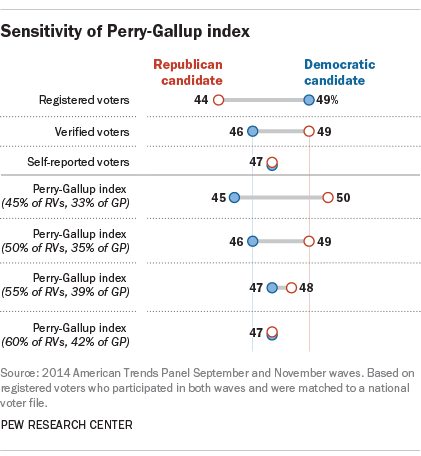
The candidate preferences of voters and nonvoters in 2014 were very different. This fact makes cutoff methods very sensitive to the chosen turnout threshold. Using the Perry-Gallup method, the forecast margin ranges from a tie vote (47%-47%) with a more inclusive model (a turnout forecast of 60% of registered voters, 42% of the general public) to a 5 percentage point Republican advantage with a more restricted model (a forecast of 45% turnout among registered voters, 33% of the general public). Using the vote among verified voters as a yardstick for where voter preferences stood at that time, a turnout forecast of 50% of registered voters (35% of the general public) comes closest to the benchmark, yielding a Republican lead of 3 points (49% to 46%).
Given that estimates for the 2014 general election put the national turnout at 35.9% of the voting eligible population, it would seem that this is the correct cutoff to use. But it is clear that the survey sample used here – registered voters who completed two waves of interviews and were matched to the voter file – overrepresented likely voters, since 63% of them (not 50%) are verified as having voted. As a result, a 60% turnout cutoff for registered voters (42% of the general population) was used for analysis.
Most survey samples are likely to have a similar bias, if not to the same extent. The problem is that it is difficult to know how much a given sample overrepresents likely voters. For this sample in this election, the Perry-Gallup method produces a forecast that is too Democratic when the appropriate cutoff is employed.


