Beyond Red vs. Blue: The Political Typology
Our typology sorts the public into nine groups based on their political and cultural values, not their party – painting a picture of American politics with far more than two colors.
Numbers, Facts and Trends Shaping Your World
Read our research on:

Our typology sorts the public into nine groups based on their political and cultural values, not their party – painting a picture of American politics with far more than two colors.

Our latest politics data every month
All
Publications
Survey Report From the start, the Republican presidential field for 2016 has been much more crowded than the Democratic field. But voters in each party have similar views of the quality of their party’s candidates. Nearly six-in-ten (57%) Republican and Republican-leaning registered voters say they have an excellent or good impression of their party’s presidential […]
The analysis in this report is based on telephone interviews conducted May 12-18, 2015 among a national sample of 2,002 adults, 18 years of age or older, living in all 50 U.S. states and the District of Columbia (700 respondents were interviewed on a landline telephone, and 1,302 were interviewed on a cell phone, including […]
Hillary Clinton’s favorability ratings have fluctuated substantially throughout her more than two decades in public life. Her ratings today are at the lowest level since her last presidential race in 2008. Read the report →
Though crude oil continues to be the nation’s single biggest import, energy exports have risen sharply. Exports of some metals and agricultural products also have grown rapidly.
A Pew Research Center experiment found several key areas where Web surveys produced different results than those conducted by phone.
The U.S. Supreme Court remains an institution whose members – and even the facts about some of its most important decisions – are a mystery to many Americans.
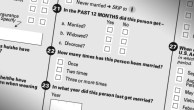
Under pressure from academics and advocates, the U.S. Census Bureau has abandoned plans to delete a series of questions about marriage and divorce from its largest household survey.
A new Pew Research Center analysis of the months leading up to election day finds that four of the six parties studied received more negative commentary than positive.
The public sees a number of contributing factors for the outbreak of violence and unrest in Baltimore last week, and most say it was the right decision to charge some Baltimore police officers in the death of Freddie Gray.
Survey Report Over the past decade, there has been a pronounced age gap in American politics. Younger Americans have been the Democratic Party’s strongest supporters in both vote preferences and partisanship, while older Americans have been the most reliably Republican. The Pew Research Center’s report earlier this month on partisan identification found that 51% of […]
Our typology sorts the public into nine groups based on their political and cultural values, not their party – painting a picture of American politics with far more than two colors.
Take our quiz to find out which one of our nine political typology groups is your best match.
Pew Research Center’s in-depth study of its survey respondents who voted in the 2024 election examines turnout, voting patterns and demographics.
In this interactive feature, explore how changes between the 2020 and 2024 elections in how – and whether – people voted helped to return President Trump to office.